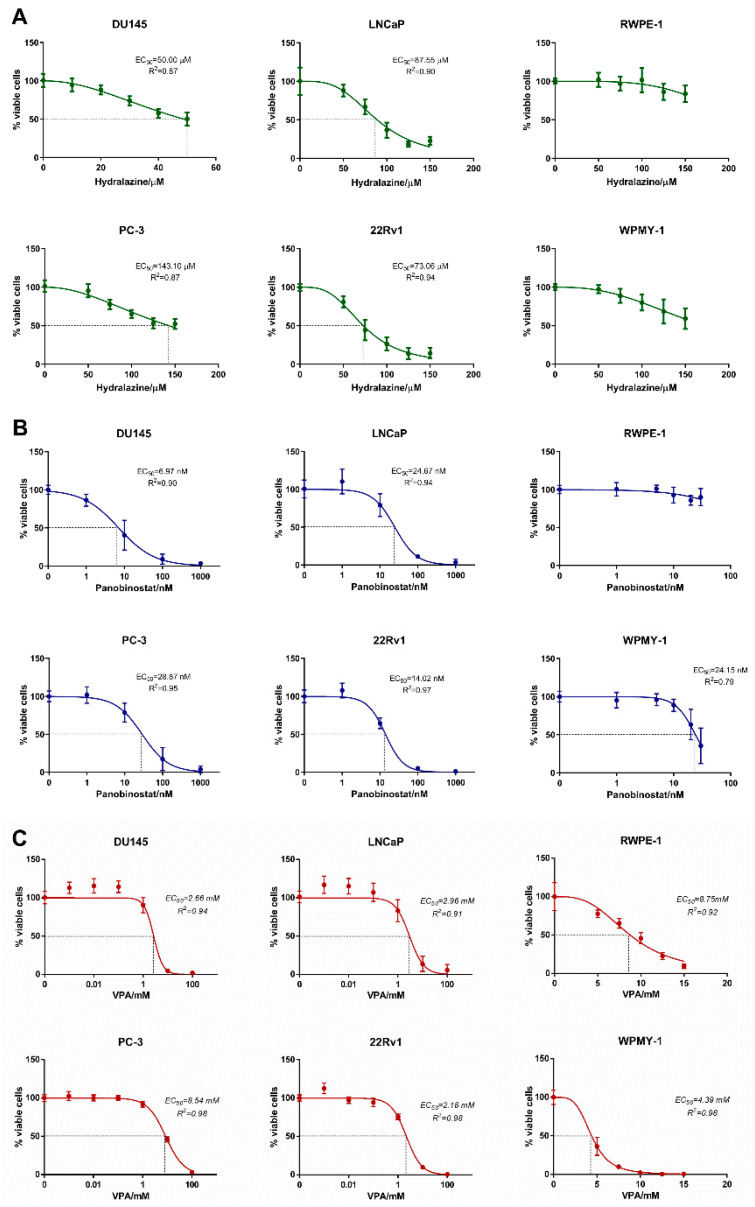
Figure 1.
Dose–response curves. Cell viability measured by resazurin in DU145, PC-3, LNCaP, 22Rv1, RWPE-1 and WPMY-1 exposed to hydralazine (A), panobinostat (B) and valproic acid (C) at day 3. Experiments were performed in triplicates of three biological replicates (n = 3), normalized to the respective vehicle and to day 0. EC50 values at day 3 are indicated in each graph.

