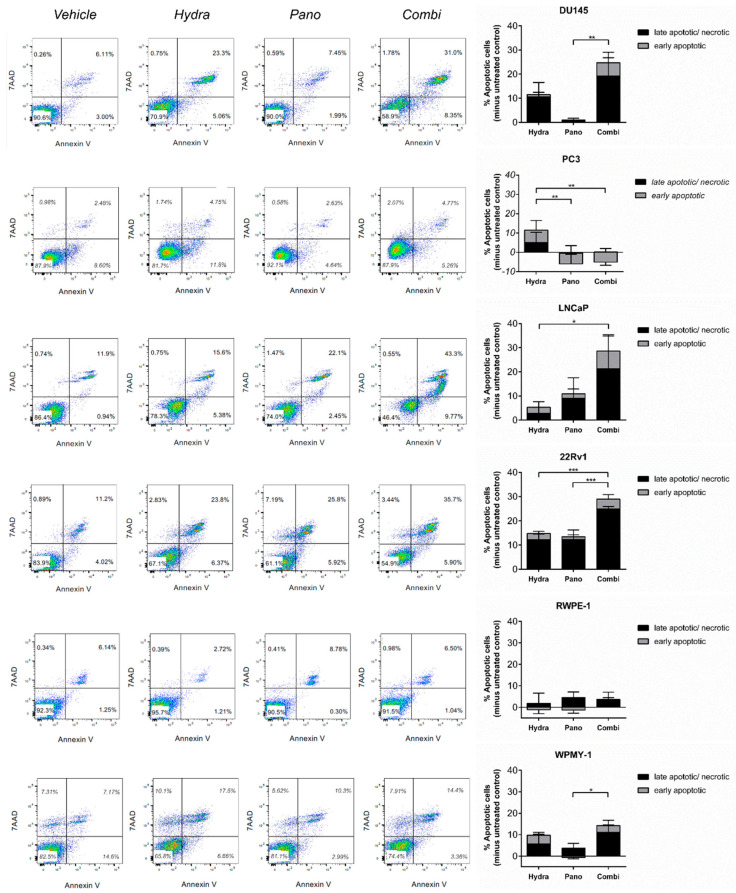
Figure 3.
Hydralazine and panobinostat exposure induced apoptosis in DU145, LNCaP and 22Rv1. Cells were treated with the selected combinations, stained with annexin V and 7-AAD and analyzed by flow cytometry. A representative image is shown (left panel). The percentage of apoptotic cells of DU145, LNCaP and 22Rv1 is shown in the right panel. Experiments were carried out in three biological replicates (n = 3). Mean values ± SD are shown (right panel), analyzed by two-way ANOVA with Tukey’s test for multiple comparisons. Drug concentrations: DU145–Hydra: 50 µM, Pano: 5 nM; PC-3, RWPE-1 and WPMY-1–Hydra: 100 µM, Pano: 10 nM; LNCaP–Hydra: 100 µM, Pano: 5 nM; 22Rv1–Hydra: 75 µM, Pano: 1 nM). * p < 0.05; ** p < 0.01; *** p < 0.001.

