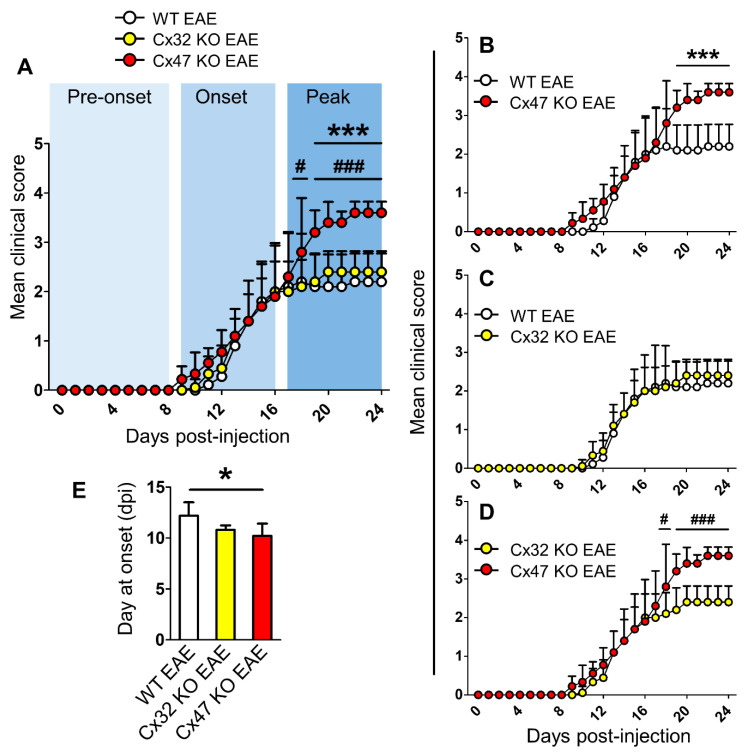
Figure 1.
Timeline of clinical course in WT, Cx32 KO, and Cx47 KO EAE mice up to 24 dpi. (A–D) Comparison of mean clinical scores (MCS) of WT, Cx32 KO, and Cx47 KO EAE mice (A), of WT vs. Cx47 KO EAE mice (B), of WT vs. Cx32 KO EAE mice (C), and of Cx32 KO vs. Cx47 KO EAE mice (D). As mice were sacrificed at 7 days, 12 days, and 24 days post-injection (dpi) for subsequent analyses, the sample size used from each group was as follows: 0–7 dpi (n = 13 per genotype), 8–12 dpi (n = 9 per genotype), and 13–24 dpi (n = 5 per genotype). Data are presented as MCS ± SD. Two-way ANOVA with post hoc Bonferroni test: WT EAE vs. Cx47 KO EAE (*** p < 0.001); Cx32 KO EAE vs. Cx47 KO EAE (# p < 0.05, ### p < 0.001). (E) Comparison of mean EAE disease onset between n = 5 WT, n = 5 Cx32 KO, and n = 9 Cx47 KO EAE mice. Data is shown as mean ± SD. One-way ANOVA with post hoc Tukey’s HSD test: * p < 0.05.

