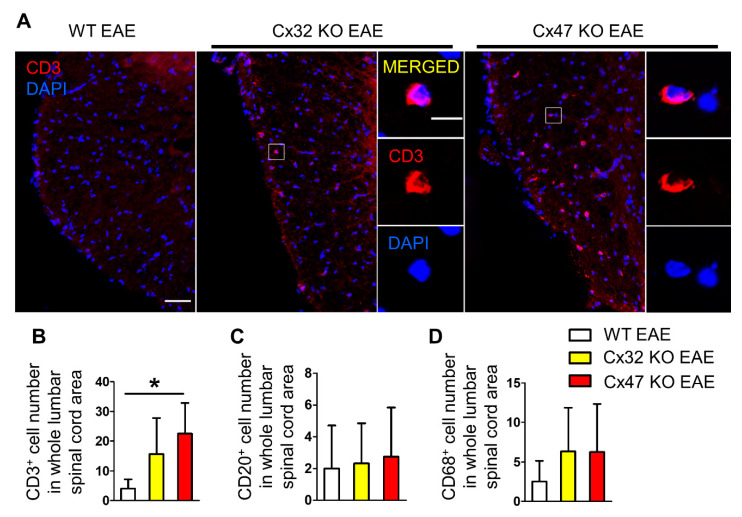
Figure 5.
Assessment of CD3+ T-cell, CD20+ B-cell, and CD68+ macrophage infiltrates in the lumbar spinal cord of WT and Cx47 KO EAE mice at 7 dpi. (A) Representative immunofluorescence overview images of lumbar spinal cord cross sections from 7 dpi WT EAE, Cx32 KO EAE, and Cx47 KO EAE mice as indicated (all with a clinical score of 0), stained against the T-cell marker CD3 (red), and counterstained with DAPI (blue). Higher magnification single channels and overlap images from squared boxes are shown in insets on the right. Scale bars: in overviews = 50 μm; in insets = 10 μm. Counts of CD3+ T-cells (B), CD20+ B-cells (C), and CD68+ monocytes/macrophages (D) in the whole lumbar spinal cord area of n = 4 WT EAE, n = 3 Cx32 KO EAE, and n = 4 Cx47 KO EAE mice. Data are presented as mean ± SD. One-way ANOVA with post hoc Tukey’s HSD test: * p < 0.05.

