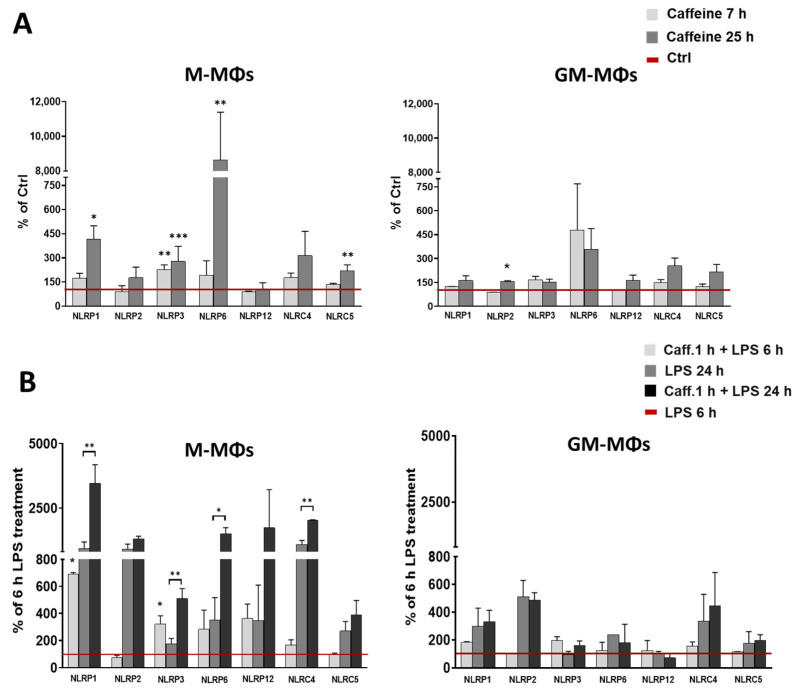
Figure 2.
Effects of caffeine on NLRs expression in M-MΦs and GM-MΦs. The relative gene expression of indicated genes was measured by qPCR. (A) Cells were treated with caffeine (1 mM) for different time points. (B) Cells were pre-incubated with caffeine (1 mM) for 1 h, then primed with LPS (100 ng/mL) for the indicated time. Cyclophilin (Cyclo) was used as reference gene to normalize the gene expression. All results are shown as means ± SEM. (* p < 0.05, ** p < 0.01, *** p < 0.001).

