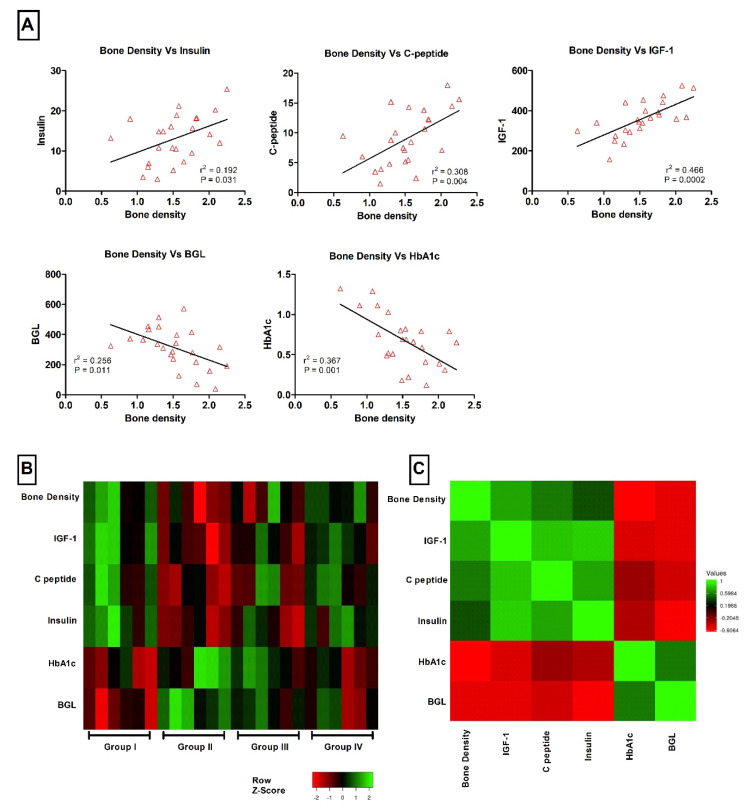
Figure 4.
Correlation analysis between bone density and multiple variables including insulin, C peptide, IGF-1, BGL and HbA1c. (A) Correlation between bone density and insulin, C peptide, IGF-1, BGL and HbA1c, respectively. p values and r2 are expressed on each figure. (B) Heat map showing the distribution of bone density and insulin, C peptide, IGF-1, BGL and HbA1c as Z score between groups. (C) Heat map showing the pairwise Pearson correlation analysis expressed as r values.

