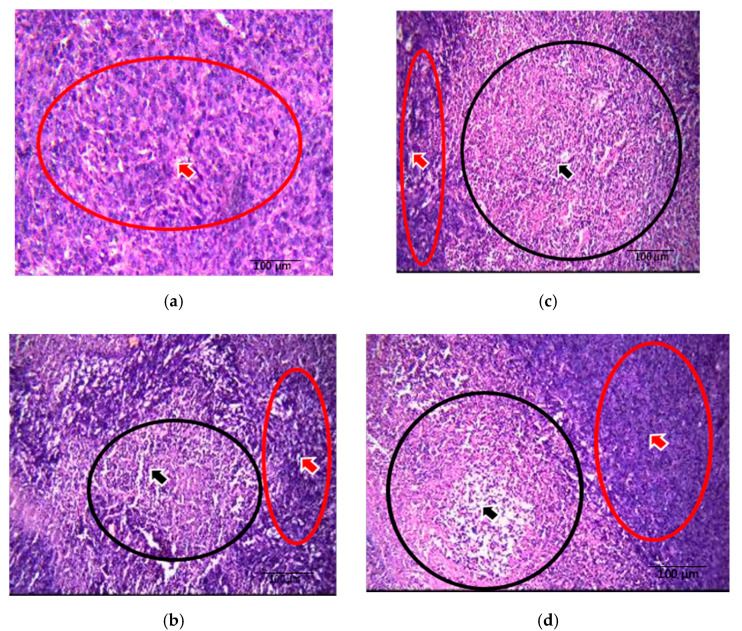
Figure 4.
Comparison of tumor necrosis in breast tissue upon tocotrienol and Spirulina treatment. Photomicrographs (H&E, 200×) of breast tumor tissue from mice from the different treatment groups. The (a) control (non-treated), (b) Spirulina (50 mg/kg body weight), (c) γT3 (1 mg/day), and (d) combination of γT3 and Spirulina treated mice. Red colored arrow and circle indicate viable tumor cells, while the black colored arrow and circle indicate necrotic tumor cells.

