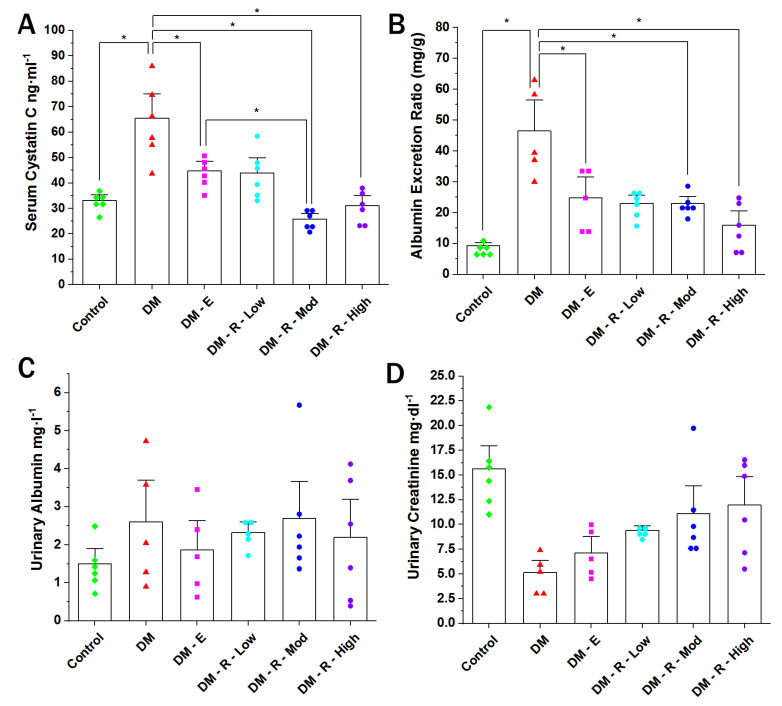
Figure 1.
Effect of ruxolitinib on serum cystatin (A), albumin excretion ratio (B), urinary albumin (C), and urinary creatinine levels (D). (A) Cystatin C level in the sera of normal, diabetic treated, and non-treated male Wistar rats. (B) Bar graph showing urinary albumin excretion of normal (control), diabetic treated, and non-treated male Wistar rats (n = 6). Data are represented as individual values for each mouse (dots). Statistical significance is shown by asterisks (* p < 0.05). The difference among groups was assessed by the Kruskal–Wallis test followed by the Mann–Whitney U test for post hoc group binary comparisons. DM, diabetic non-treated group, DM-E, diabetic enalapril-treated group (10 mg·kg−1), DM-R-Low, diabetic ruxolitinib-treated low-dose group (0.44 mg·kg−1), DM-R-Mod, diabetic ruxolitinib-treated moderate-dose group (2.2 mg·kg−1), DM-R-High, diabetic ruxolitinib-treated high-dose group (4.4 mg·kg−1).

