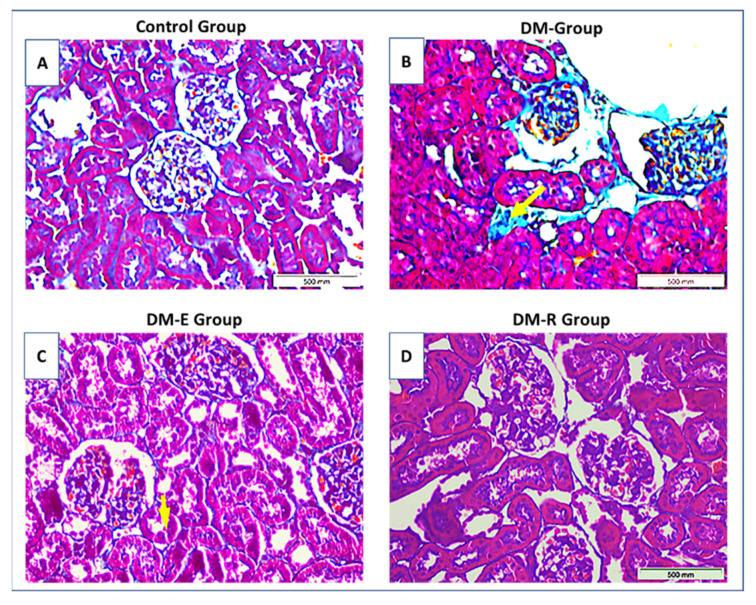
Figure 4.
Light-microscopic findings in the study groups. Representative pictures of Masson Trichrome-stained tissue sections from (A–D) Ctrl group (A), DM group (B), enalapril-treated group DM-E (C), and ruxolitinib-treated group DM-R (D). A. Control group showing normal glomerular and tubular structures. B. Glomeruli in the DM group showing increased periglomerular fibrosis (stained in blue) as well as interstitial fibrosis (arrow). C. DM-E group showing improvement of both glomerular and interstitial fibrosis. D. DM-R group showing improvement of both glomerular and tubular changes. Note that glomerular diabetic changes are less evident in the DM-R group than in the DM-E group. Ctrl: control, DM: untreated group, DM-E: enalapril-treated group, DM-R: ruxolitinib-treated group. Original magnifications ×400.

