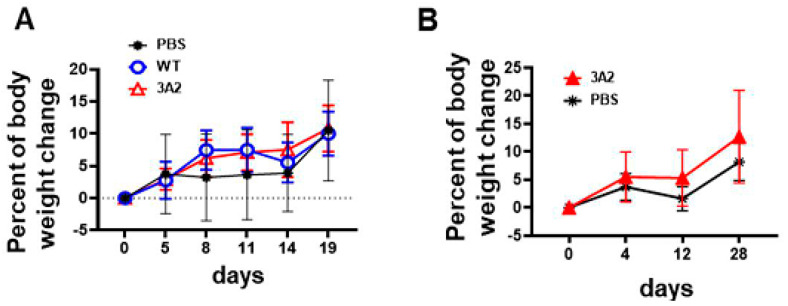
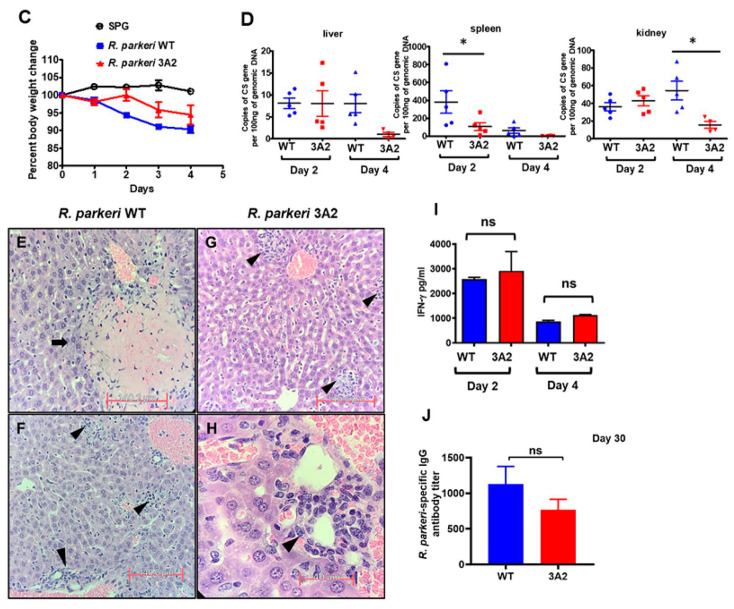
Figure 4.
Evaluation of the virulence and immunogenicity of R. parkeri 3A2 in mice. C3H/HeN mice were inoculated i.d. (immunized) with R. parkeri 3A2 at a dose of 1 × 10^3 (A) or 1 × 10^5 (B) copies of CS gene per mouse. Mice inoculated with PBS and the same dose of R. parkeri WT served as negative and positive controls, respectively. Mice were monitored for skin lesions at the injection site and weight loss. (C) C3H/HeN mice were inoculated i.v. with R. parkeri 3A2 at a dose of 3 × 10^5 copies of CS genes per mouse. Mice inoculated i.v. with sucrose-phosphate-glutamate (SPG) buffer and the same dose of R. parkeri WT served as negative and positive controls, respectively. After infection, mice were monitored, and weight loss was calculated. On days 2 and 4 p.i., mice were euthanized. Tissues were collected to determine the loads of rickettsiae by quantitative real-time PCR amplifying citrate synthase (CS) gene (D). On day 4 p.i., livers were collected and processed for histopathological analysis (E–H). Coagulative necrosis lesions (arrows) were present only in livers of mice infected with WT R. parkeri (E), but not R. parkeri 3A2. Foci of inflammatory cells, apoptotic cells, and perivascular inflammation (arrowheads) were observed in livers of all infected mouse groups (F–H). In (E–G), scale bar = 140 µm. In H, scale bar = 40 µm. On day 4 p.i., sera were collected from mice infected i.v. with R. parkeri WT or 3A2. The concentrations of IFN-γ in serum were determined by ELISA (I). On day 30 post immunization, serum was collected. The titer of R. parkeri WT-specific IgG antibody was determined by indirect immunofluorescent assay (IFA) (J). Each group included 4–10 mice. Data represent two independent experiments with similar results. * p < 0.05; ns, not statistically significant.


