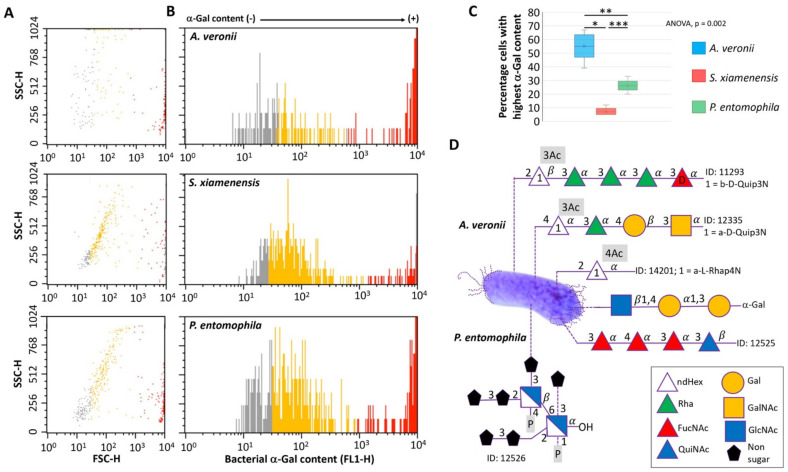
Figure 2.
The carbohydrate structure and α-Gal content in potential probiotic bacteria. (A) Density plot representing bacteria that were gated by forward (FSC-H) and side (SSC-H) scatter. (B) Bacteria are represented in a histogram to evaluate the relative α-Gal levels (FL1-H). Cells were incubated with the α-Gal epitope monoclonal antibody M86. FITC-goat anti-mouse IgM-labeled antibodies were used as a secondary antibody. Samples were analyzed on a FAC-Scalibur flow cytometer equipped with CellQuest Pro software v.4. The viable cell population was gated according to forward-scatter (FSC-H) and side-scatter (SSC-H) parameters. (C) The percentage of viable cell population with highest α-Gal content (with mean fluorescence intensity >103 FSC-H; red marks) was compared between different bacteria by one-way ANOVA test (p < 0.005) followed by post hoc Holm multiple comparisons (* p = 0.002, ** p = 0.02, *** p = 0.04, n = 5 biological replicates). (D) The bacterial carbohydrate structure for bacteria identified in the zebrafish microbiota with highest α-Gal content, namely A. veronii and P. entomophila, was characterized by using the Bacterial Carbohydrate Structure Database. The α-Gal was included as reported here in both bacteria. Compound IDs are shown. IUPAC condensed terms are disclosed in Materials and Methods.

