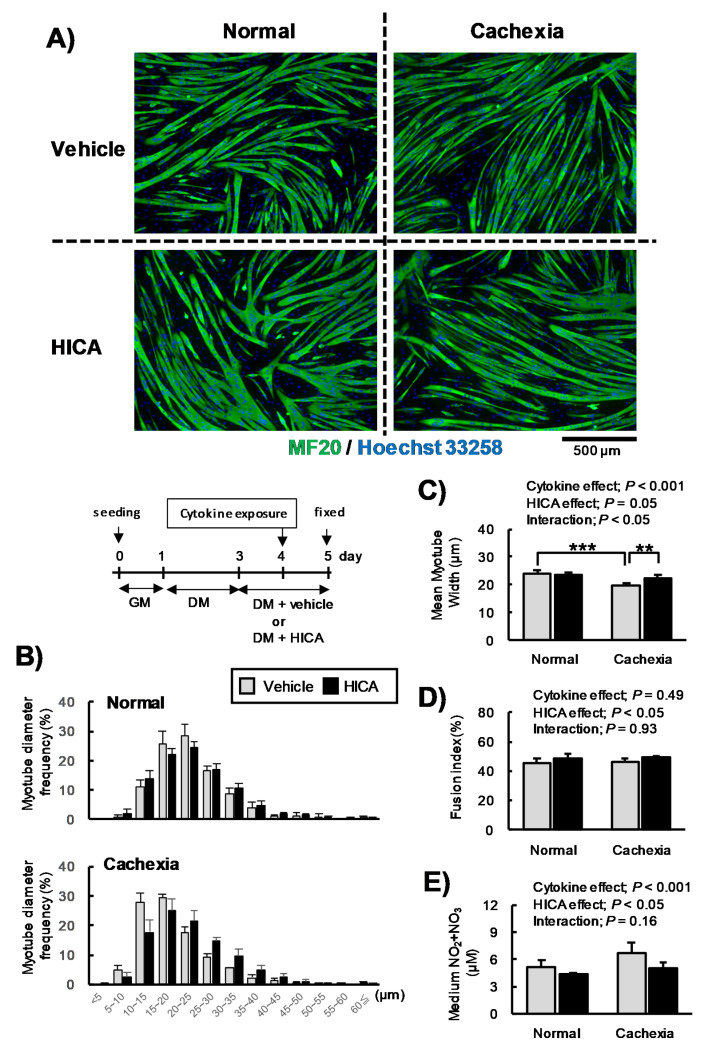
Figure 4.
Effects of HICA on myotube atrophy. Typical myosin- (green; MF20) and nuclear (blue; Hoechst 33258)-stained myotubes are shown (A). Distributions of the diameters of the tubes in the vehicle- and HICA-treated groups under normal (upper panel) or cachexic conditions (lower panel) are shown (B). Mean myotube diameters are shown (C), the fusion indices are shown (D), and the nitric oxide secretion (expressed as µM total NOx in the medium) is shown (E). The time course of these experiments is shown in the upper region (B). GM: growth medium and DM: differentiation medium. Data are presented as the means ± SD for each group (n = 4). The diameter of the 218–323 myotubes per each chamber were measured. The results of the two-way ANOVAs are shown in the upper region (C,D). ** p < 0.01 and *** p < 0.001 per the results of a post hoc simple main effect test.

