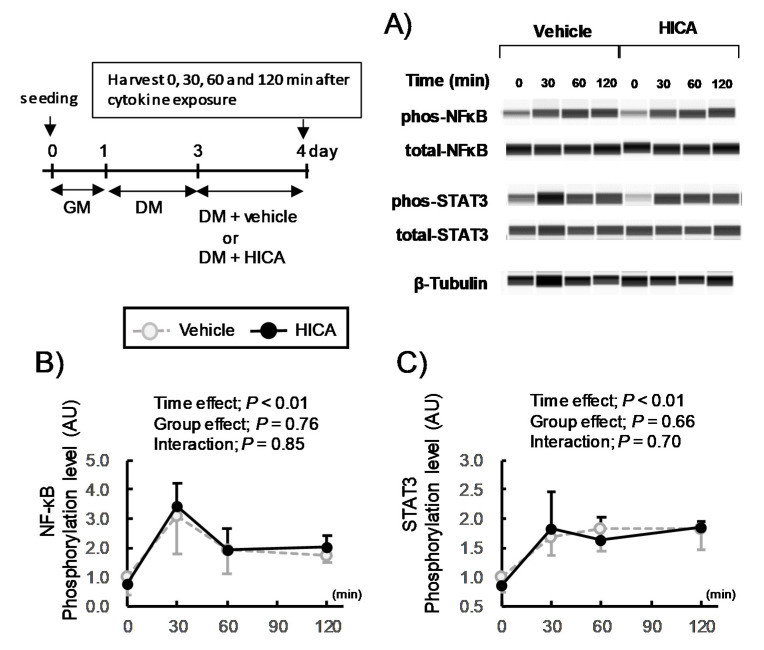
Figure 5.
Effects of HICA on the acute cytokine signaling events. A typical image for capillary immunoassays is shown (A). The phosphorylation levels of (B) STAT3 and (C) p65NFκB in the whole-cell lysate were quantified. The phosphorylation levels were normalized to the total amount of that protein. β-Tubulin was used as a loading control (A). The time course of this set of experiments is shown in the left upper panel. GM: growth medium and DM: differentiation medium. Data are presented as the means ± SD (n = 3). The results of the one-way ANOVAs are shown in the upper regions (B,C).

