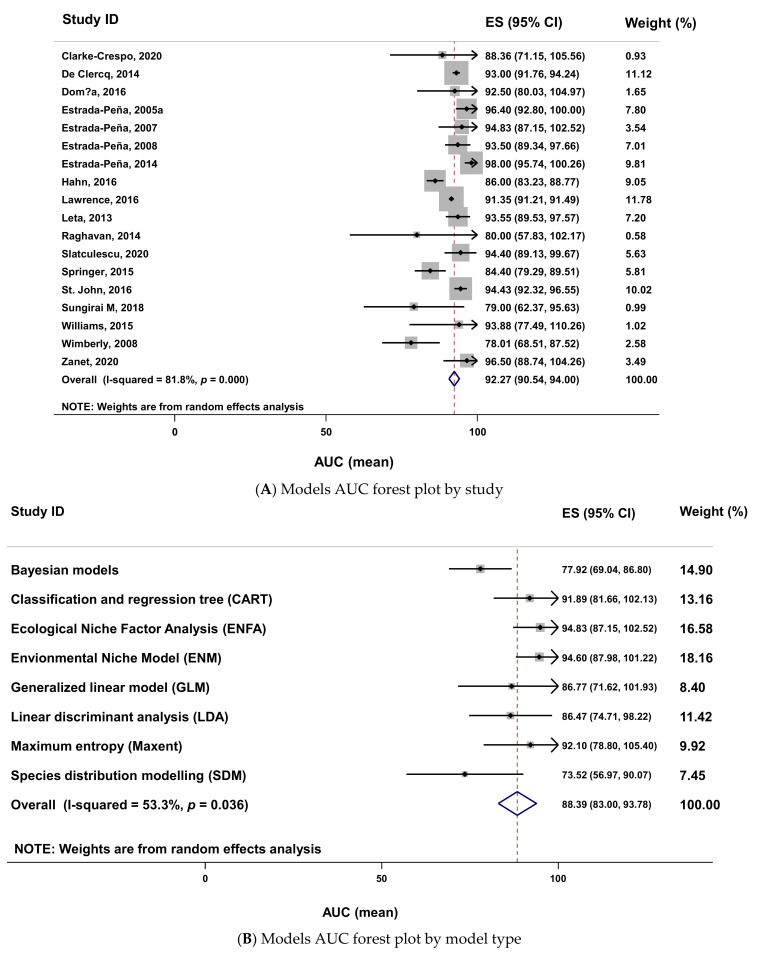
Figure 10.
Forest plot (A,B) of the AUC of models using meta-analysis. Forest plot legend: ES (effect size); CI (confidence interval); AUC (area under the curve); names on the left (first author of primary studies or model’s name); solid dot (AUC mean); grey square size (weight of each study); horizontal lines (95 confidence intervals); vertical line (line of no effect); diamond (overall AUC effect); vertical dash line (combined AUC effect); tips of diamond (95% confidence intervals).

