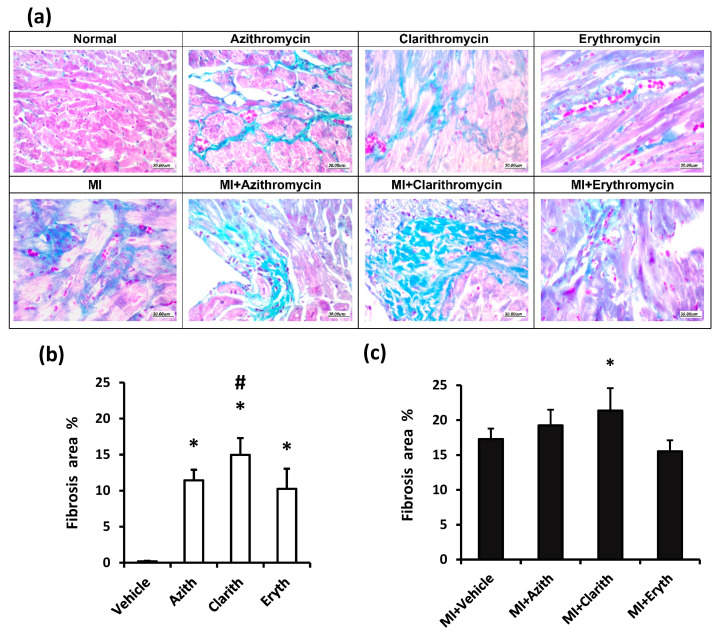
Figure 5.
Masson’s trichrome staining for cardiac specimens in the two rat experiments. (a) Images for specimens were taken from healthy or MI rats treated with azithromycin (Azith), clarithromycin (Clarith), or erythromycin (Eryth). (b) Fibrosis % for healthy rat experiment and (c) Fibrosis % for MI rat experiment. MI: myocardial infarction. Data are medan ± standard deviation for each set’s histologic score analyzed separately by one-way ANOVA and Bonferroni’s test. * p-value less than 0.05, different from the vehicle group. # p-value less than 0.05: different from the azithromycin group of the same experiment (n = 4–6).

