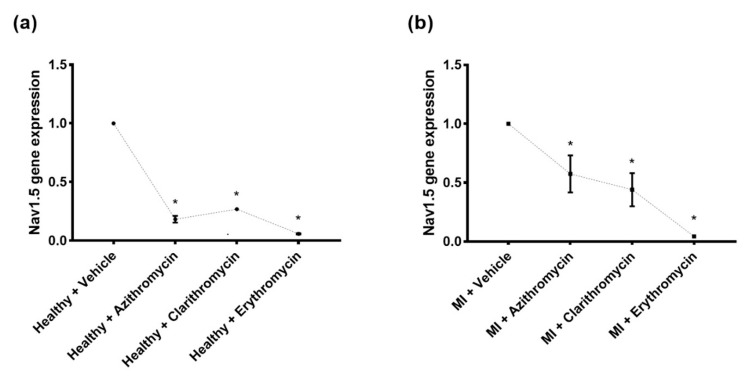
Figure 7.
Cardiac SCN5A gene expression analysis in the study rat groups. Glyceraldehyde-3-phosphate dehydrogenase (GAPDH) was applied as an endogenous control in Real-Time PCR runs for data normalization. Relative quantification of the SCN5A gene expression was done based on the quantitative cycle (Cq) values generated from the PCR with the equation: 2−ΔΔCq where ΔΔCq (delta delta quantitative cycle) = (Cq SCN5A − Cq GAPDH)MI group − (Cq SCN5A − Cq GAPDH)Healthy control [13]. (a). Normal rats were subjected to azithromycin, clarithromycin, and erythromycin (200 mg/kg for each drug) versus normal rats without treatment (healthy control). (b). Rats with induced myocardial infarction (MI) subjected to treatment with the same antibiotics versus the MI control group. The mean value of the controls in each group was set at value 1. * Significantly different from saline group in panel (a) (p-values < 0.001), * Significantly different from MI group in panel (b) (p-values < 0.001).

