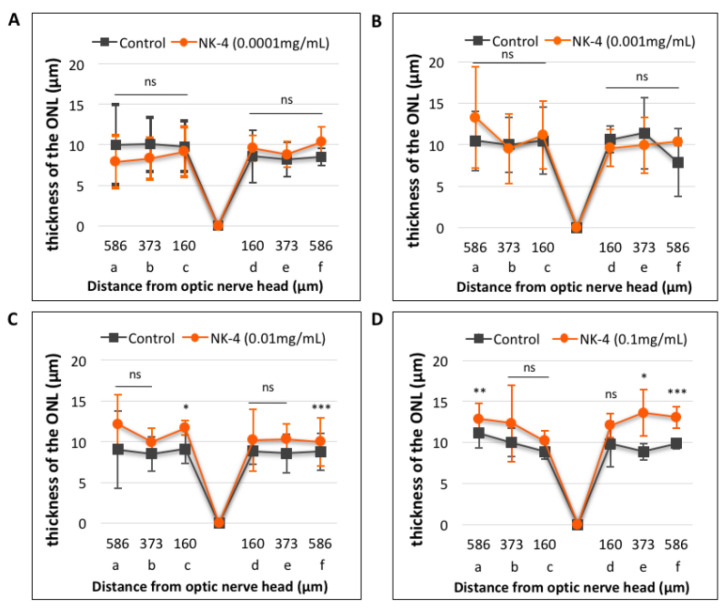
Figure 5.
Quantitative analysis of the thickness of the ONL in retinal sections. (A): NK-4 (0.0001 mg/mL)-injected retinas vs. control groups; (B): NK-4 (0.001 mg/mL)-injected retinas vs. control groups; (C): NK-4 (0.01 mg/mL)-injected retinas vs. control groups; (D): NK-4 (0.1 mg/mL)-injected retinas vs. control groups. The thickness in the ONL: NK-4 (0.1 mg/mL) vs. control vehicle-injected eyes (site a: p = 0.00753, site e: p = 0.01125, site f: p = 0.00067, Student’s t-test). The thickness in the ONL: NK-4 (0.01 mg/mL) vs. control vehicle-injected eyes (site c: p = 0.00344, site f: p = 0.00055, Student’s t-test). *: p < 0.05, **: p < 0.01, ***: p < 0.001.

