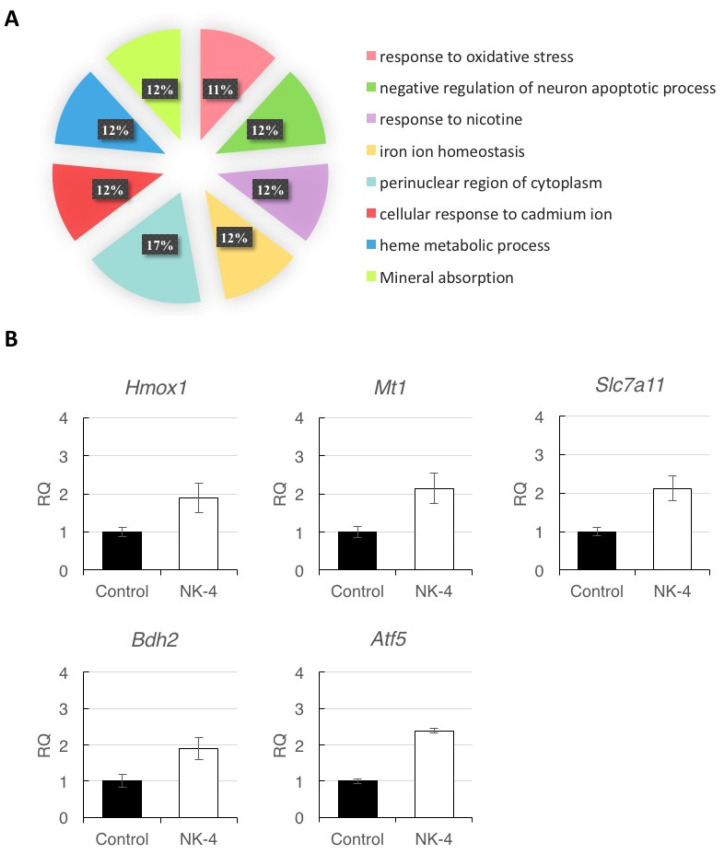
Figure 7.
(A) Analysis of affected functional processes of DEGs. DEGs were submitted for DAVID analysis, and affected functional processes are shown. Significance was accepted at a Benjamini–Hochberg p value of less than 0.01. (B) Quantitative reverse-transcription PCR analysis of Hmox1, Mt1, Slc7a11, Bdh2, and Atf5 expression in retinal samples. Since individual rats exhibited differences in expression levels of genes, data represent the mean ± SD obtained for measurements from triplicate wells and are representative of three individual rats. RQ: relative quantification.

