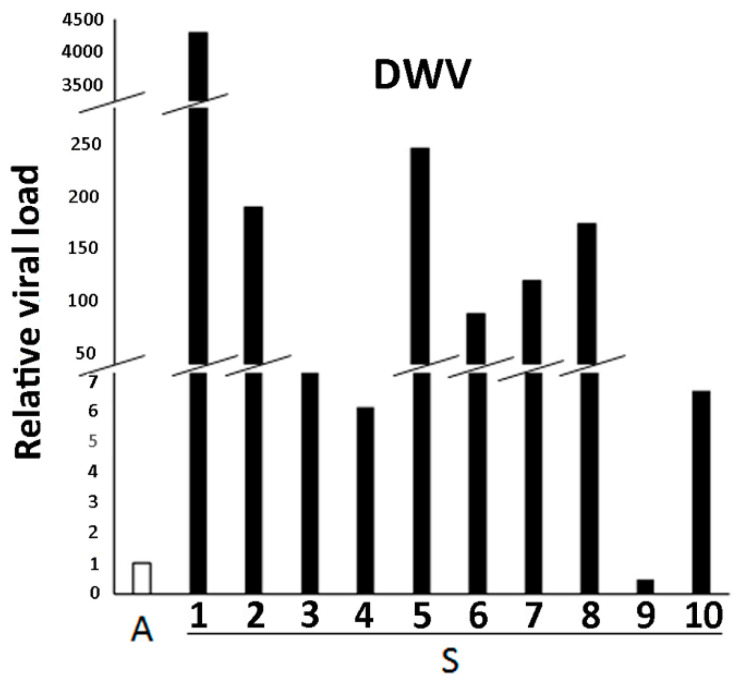
Figure 1.
Analysis of relative viral load in honeybee samples showing clinical signs (S 1–10) compared with apparently healthy honeybee samples (A). Relative quantization data obtained by Real-time qPCR are expressed as fold change of each S sample with respect to the A samples considered as group (n = 5), which were set equal to 1, according to the 2−ΔΔCq method.

