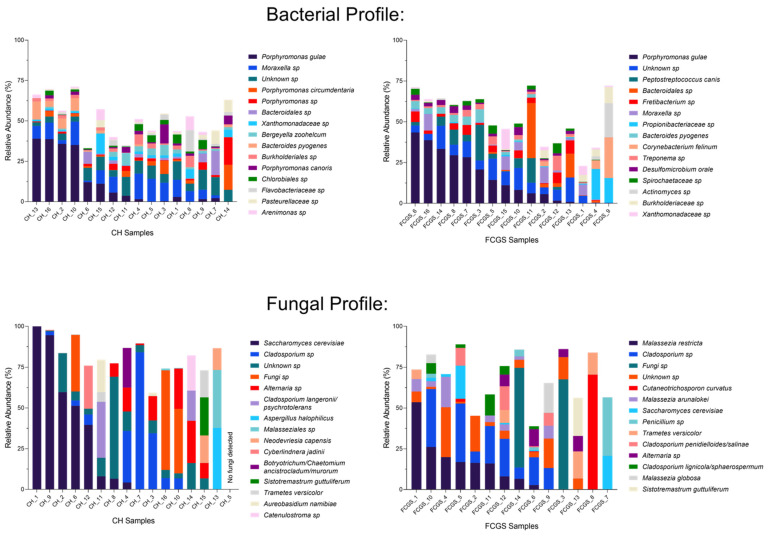
Figure 3.
Microbial taxa summary plots for bacteria (top panels) and fungi (bottom panels) in oral samples. The left-side of the figures shows CH samples, the right-side FCGS samples. Each column represents the microbial profile of one cat. Shown are the top 15 most abundant species per group, with the most abundant species being listed first.

