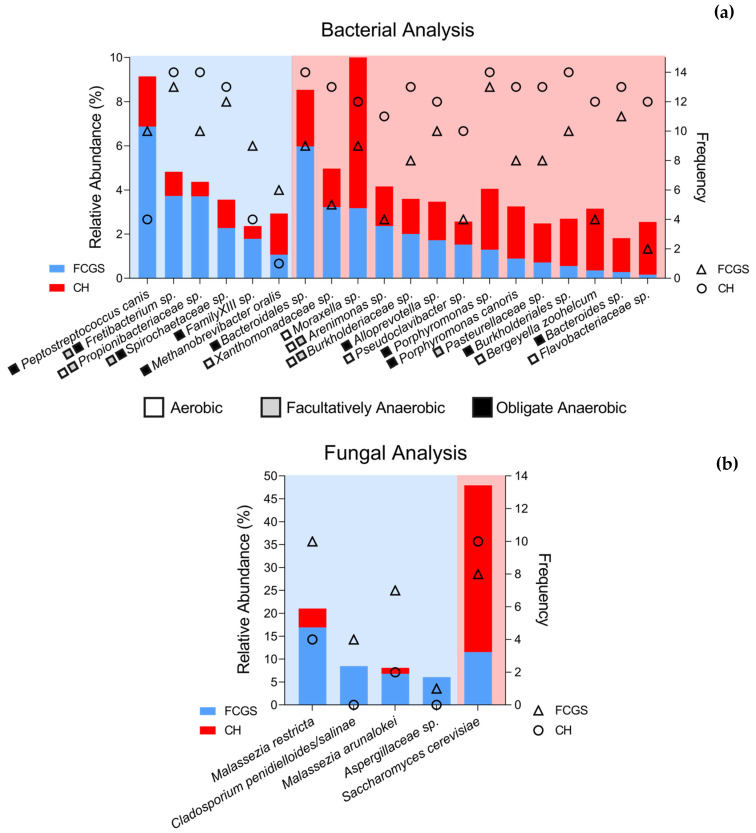
Figure 4.
LEfSe analysis summary for the (a) bacterial and (b) fungal species level highlighting species that are significantly different between groups. Bar graphs show the relative abundance of a given species in those cats that had that taxa present (left y-axis). Triangles and circles show the frequency of that given species in the dataset per group; i.e., how many cats had that species present in their microbiota (right y-axis). Shown in blue and triangles are FCGS samples, shown in red and circles are CH samples. The oxygen dependency of bacterial species is indicated by a white box for aerobic bacteria, a grey box for facultatively anaerobic, and a black box for anaerobic bacteria.

