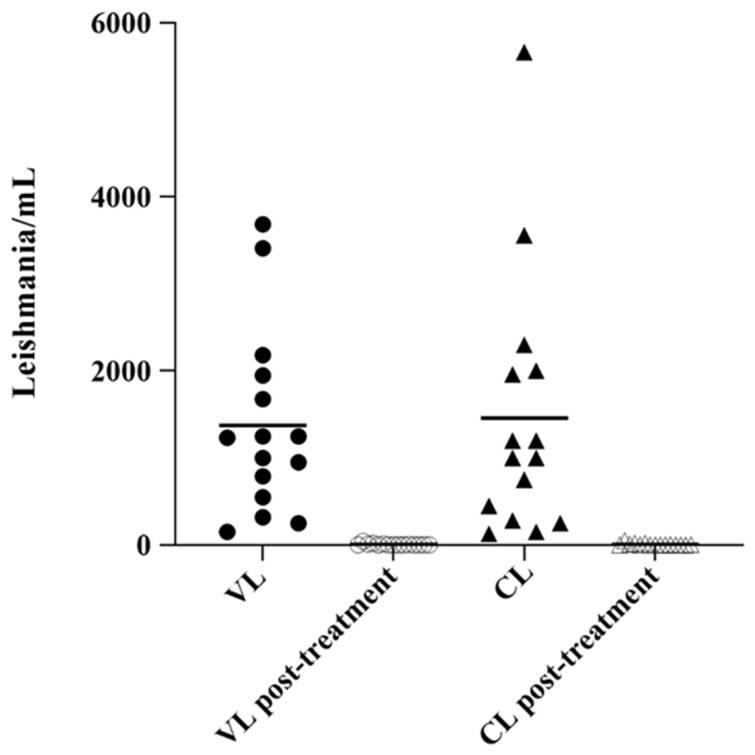
Figure 2.
Scatter plot showing parasite load in the bone marrow and tissue/skin biopsy in VL and CL samples. Parasite load in VL bone marrow (parasites/mL blood) and in lesion tissues CL samples (parasites/million nucleated cells) were determined by real-time PCR, in pre and post-treatment. The horizontal line represents the mean parasite load.

