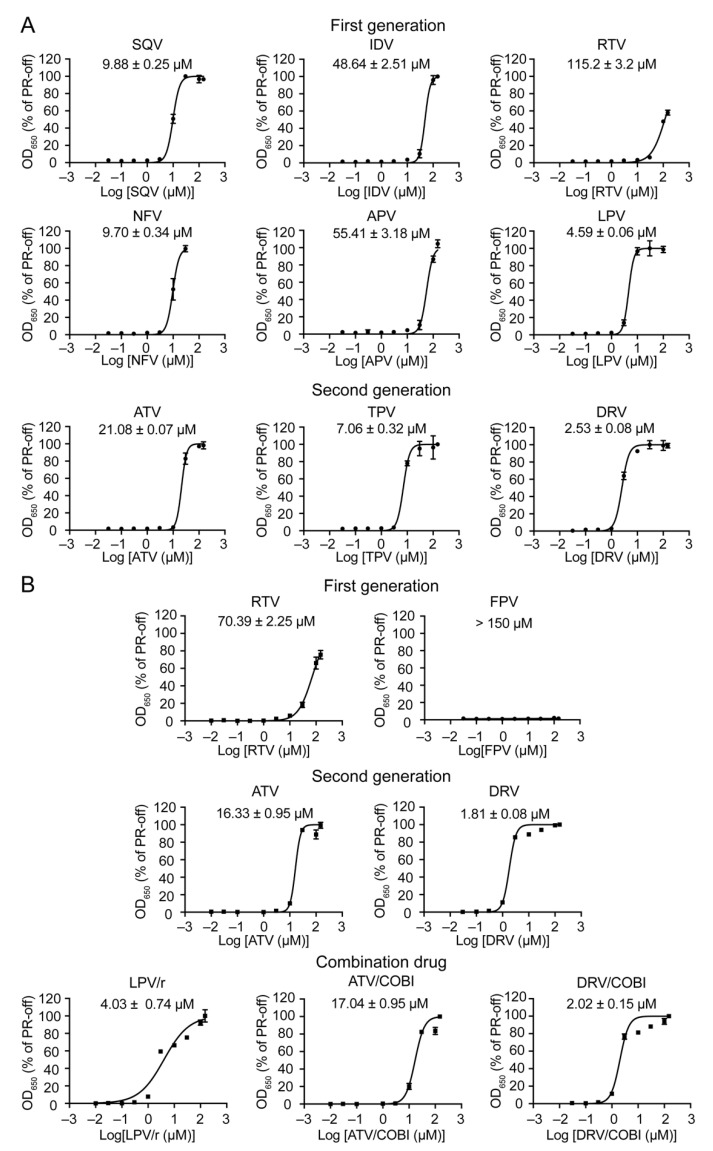
Figure 5.
Determination of half maximal effective concentration of FDA-approved PI drugs in fission yeast. (A) Pure compound of PI drugs. (B) Formulated PI drug pills. HIV-1 PR gene expression was induced in RE294 cells, as described in Figure 2. The mean EC50 of each drug was measured in triplicate by a 9-dose (0.03, 0.1, 0.3, 1.0, 3.0, 10, 30, 100, and 150 μM) scheme. Cellular growth was measured at 72 h post-gene induction by optical density of 650 nm using a spectrophotometer. EC50 curves were generated by using Prism 8 software showing averages with standard error bars. The measurements were repeated with three different experiments.

