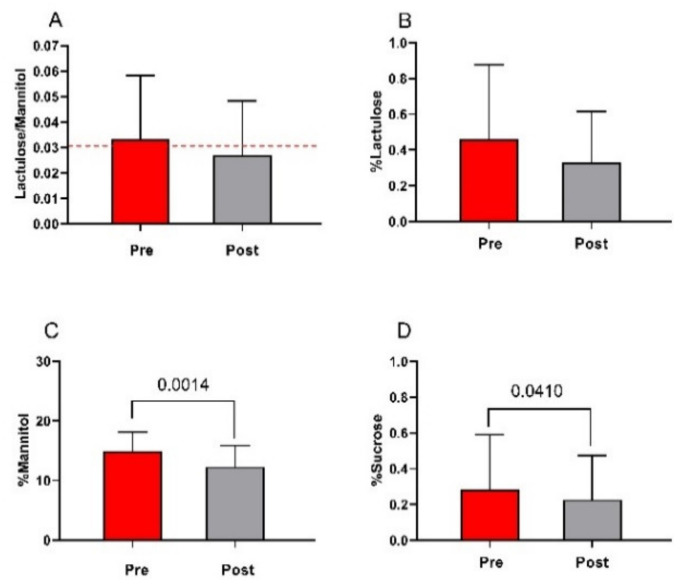
Figure 5.
The small intestinal permeability (s-IP) before and after low FODMAPs diet. Panel (A) Lactulose to Mannitol ratio; panel (B) % lactulose; panel (C) % mannitol; panel (D) % sucrose. Data are presented as mean ± SD. Statistical analysis: Wilcoxon matched-pairs signed-rank test with a significant difference set at p < 0.05. The cutoff value is indicated by the red dashed line.

