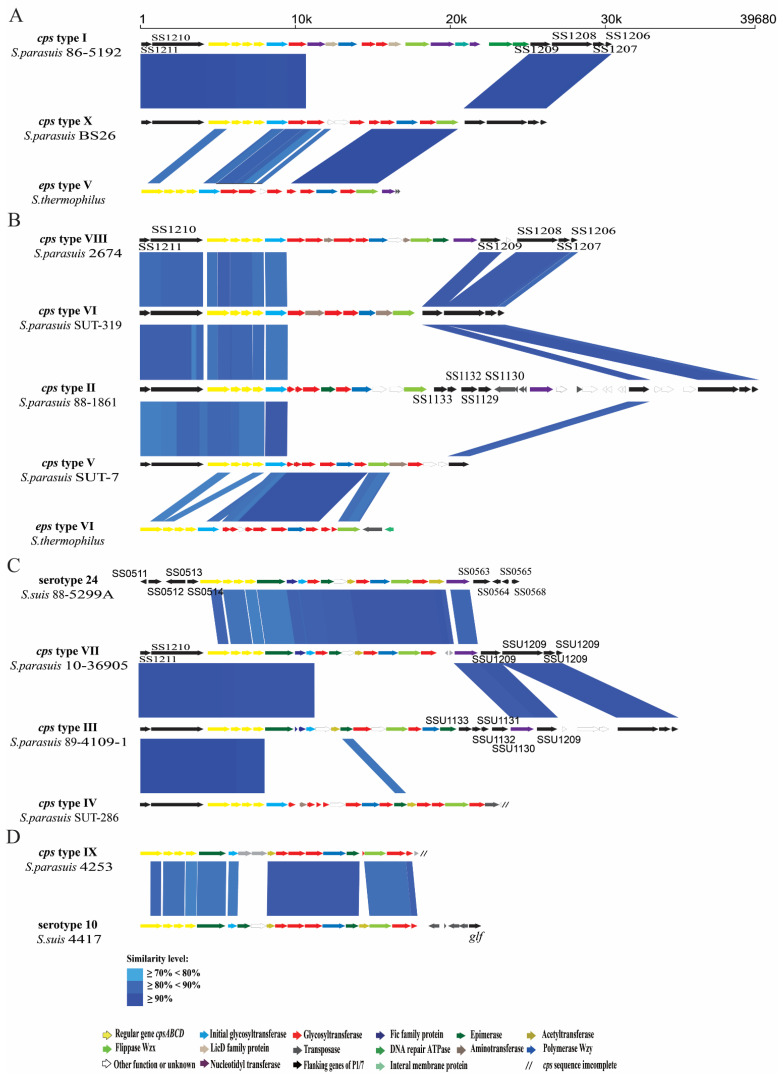
Figure 6.
Schematic comparison of the cps gene loci among (A) S. parasuis type I, X, and S. thermophilus strain type V. (B) S. parasuis type II, V, VI, VIII, and S. thermophilus strain type VI. (C) S. parasuis type III, IV type VII, and S. suis serotype 24. (D) S. parasuis type IX, and S. suis serotype 10. Each colored arrow represents a gene whose predicted function is shown in the blown-up panel. The direction of the arrow indicates the direction of transcription. Regions of 70% identity were marked by blue shading.

