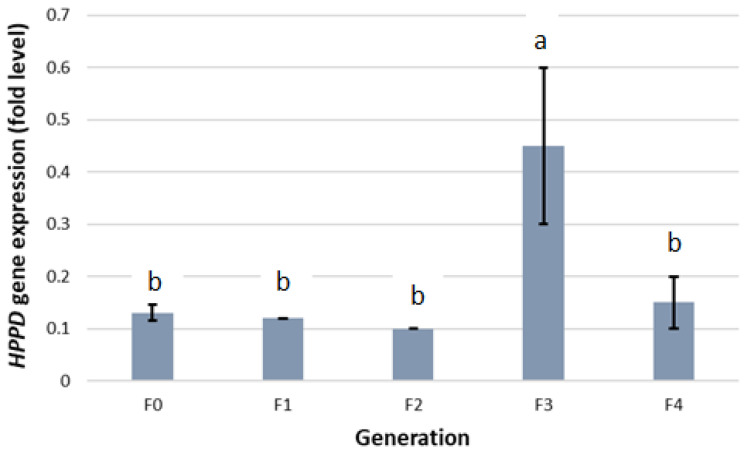
Figure 3.
HPPD gene expression in A. palmeri generations (F0, F1, F2, F3, F4). Gene expression was measured relative to the reference gene (β-tubulin) and expressed in fold levels. Data represent means of biological replicates, and error bars represent SE. Different lowercase letters above bars represent statistical difference in treatments based on Tukeys HSD test.

