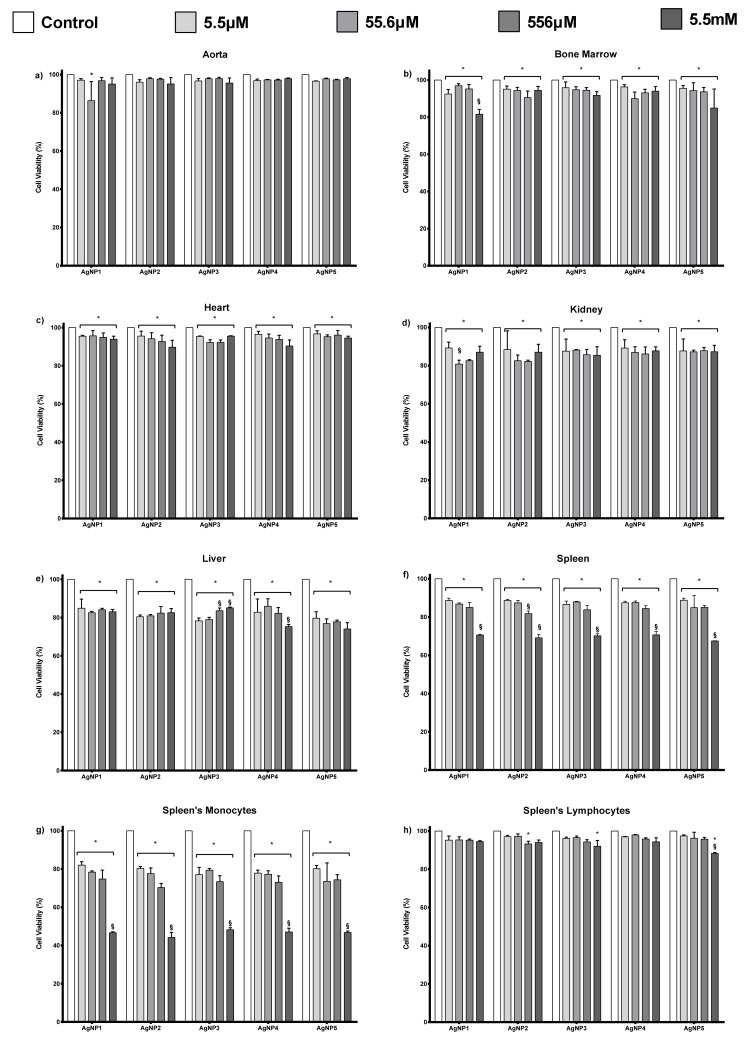
Figure 4.
Cell viability of mouse primary culture exposed for 24 h to different concentrations (5.5 µM, 55.6 µM, 556 µM and 5.5 mM) of AgNP1–AgNP5 quantified by flow cytometry. (a) Aorta, (b) bone marrow, (c) heart, (d) kidney, (e) liver and (f) spleen. Items (g,h) show the cell viability of monocytes and lymphocytes obtained from the spleen; cell populations differentiated by size and granularity. * represents statistically significant differences (p < 0.05) compared with negative control and § represents statistically significant differences (p < 0.05) between the assessed concentrations of each AgNP formulation.

