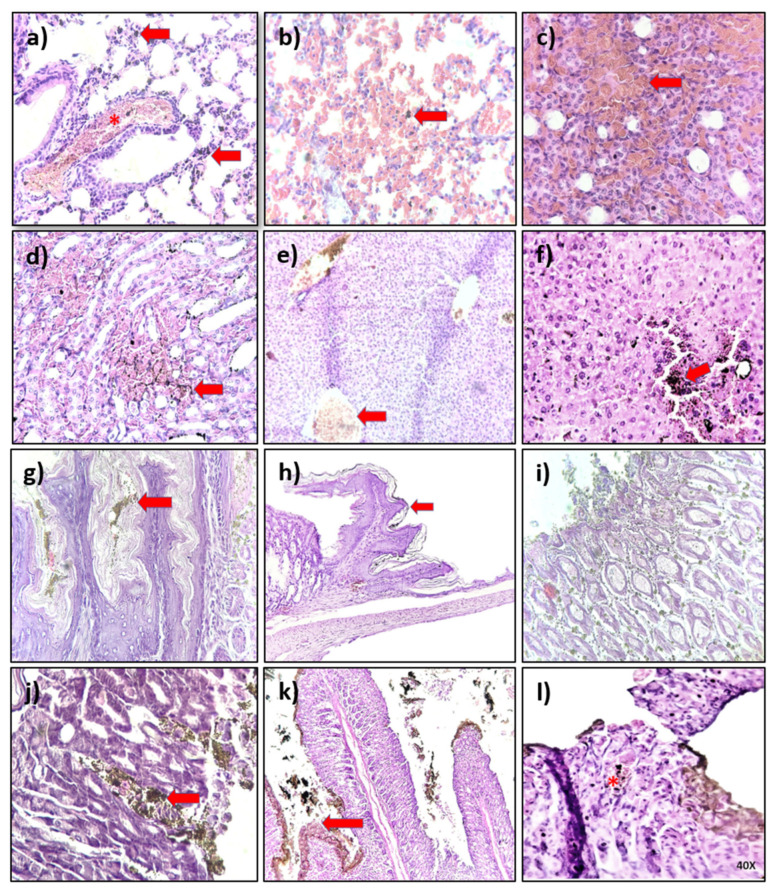
Figure 5.
Histological analysis of mice organs exposed to AgNPs formulations AgNP1–AgNP5. The photographs are representative of the damage, when observed, on the lung (a,b); kidney (c,d); liver (e,f); esophagus (g); gastroesophageal union (h); stomach (i,j), and intestine (k,l). Red arrows indicate accumulation of dark non-cellular material. Asterisks show cellular damage.

