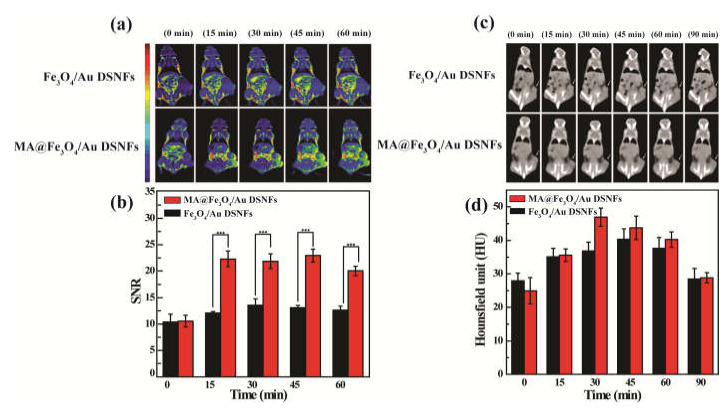
Figure 5.
In vivo tumor MR and CT imaging. (a) In vivo T1-weighted MR images and (b) the corresponding MR SNR of the 4T1 tumor anterior to injection and at diverse time points post-injection of Fe3O4/Au DSNFs and MA@Fe3O4/Au DSNFs ([Fe] = 100 μg, in 0.2 mL PBS for every mouse), separately (mean ± S.D., n = 3). The MR signal intensity of blank (air) was utilized as the background (noise). TE = 12 ms, TR = 377 ms, and ST = 2.0. (c) CT images and (d) corresponding CT values of the 4T1 cancer in ICR mice before and at diverse time points post intravenous injection of the Fe3O4/Au DSNFs and MA@Fe3O4/Au DSNFs ([Au] = 0.04 M, in 200 µL PBS for every mouse).

