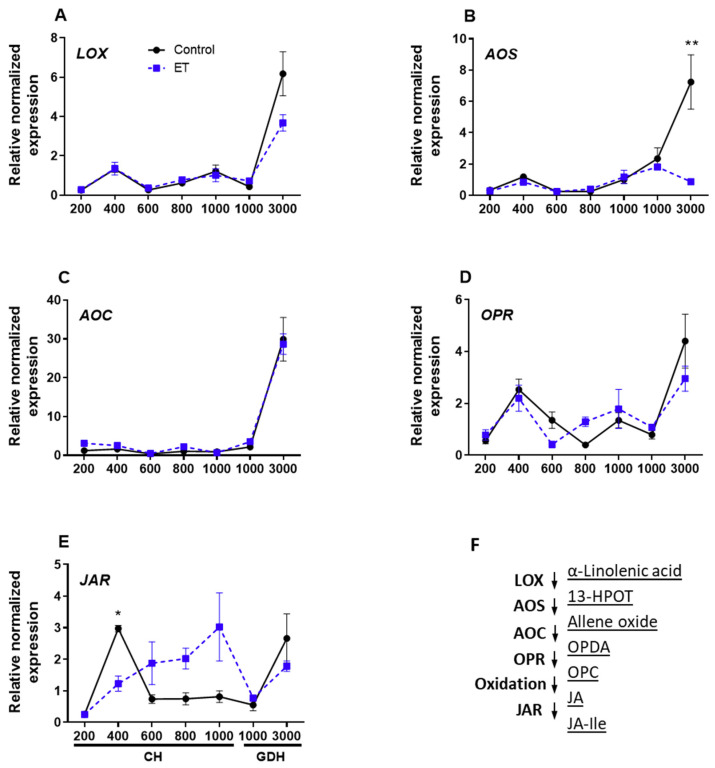
Figure 9.
Relative normalized expression of JA synthetic genes in peach ‘Redhaven’ during bud dormancy (A–E) and the schematic diagram of the JA biosynthesis pathway (F). Expression of each gene was normalized to that of β-Actin and expressed relative to the control sample (20 CH). Each point represents the mean ± SE of three biological replicates, each with technical replicates. Values marked with asterisks * and ** are significantly different at p < 0.05 and 0.01, respectively. Enzymes that sequentially catalyze the synthesis of JA and conjugation of JA-Ile are listed on the left of the downward arrows, and intermediate products are given on the right (F). LOX, lipoxygenase; AOS, allene oxide synthase; AOC, allene oxide cyclase; OPR, OPDA reductase; JAR, JA-amino synthetase; OPC, cyclopentane-1-octanoic acid; OPDA: oxo-phytodienoic acid; JAR, JA-amino acid synthetase. CH, chilling hour; GDH, growing degree hour. Refer to Figure 7 legend for the sampling dates that correspond to the CH and GDH accumulation.

