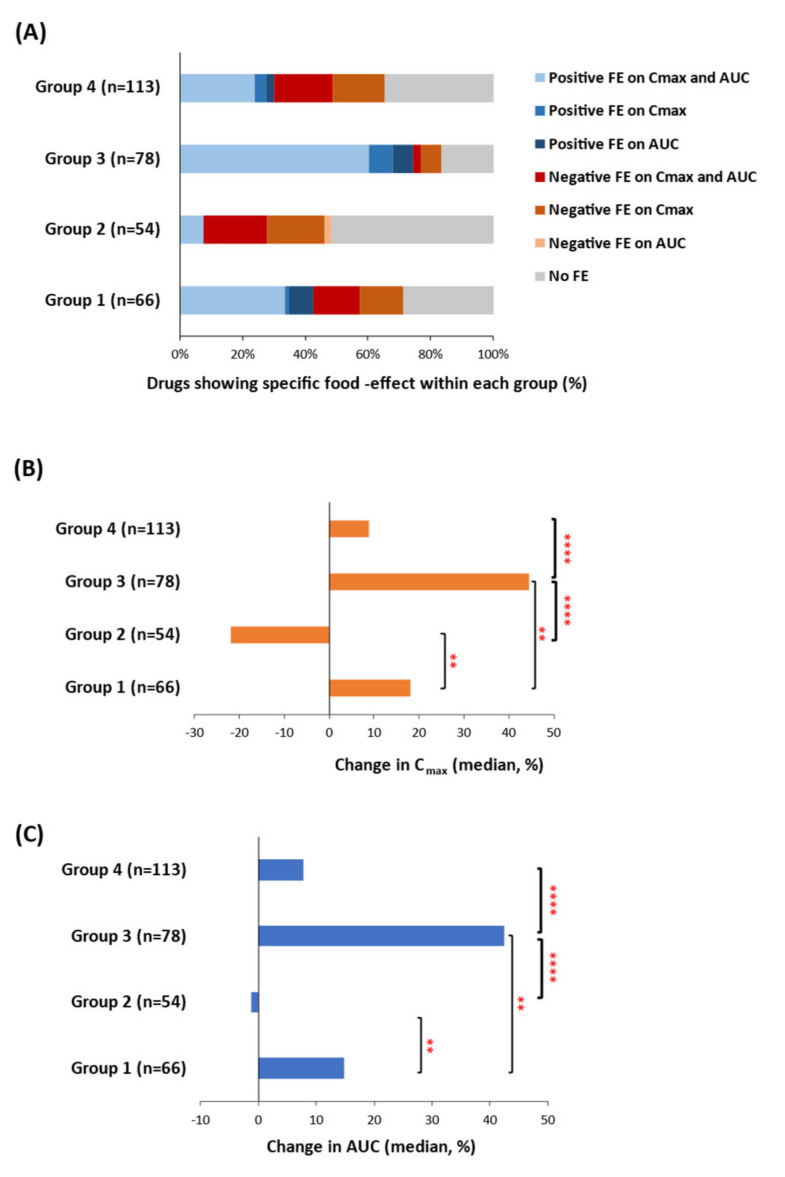
Figure 3.
The association of solubility- and permeability-limited groups (1–4) with change in the PK endpoints (Cmax and AUC). (A) Qualitative evaluation of each group to assess the frequency of drugs showing positive, negative, or no food-effect. (B) Changes in Cmax (%, median) across each group. (C) Changes in AUC (%, median) across the four groups. Kruskal–Wallis followed by Dunn’s multiple comparison tests showed a significant difference in Cmax (B) and AUC (C) between groups 1 vs. 2 (** p < 0.01), 1 vs. 3 (** p < 0.01), 2 vs. 3 (**** p < 0.0001), and 3 vs. 4 (**** p < 0.0001). The difference in AUC or Cmax between all other group pairings was non-significant.

