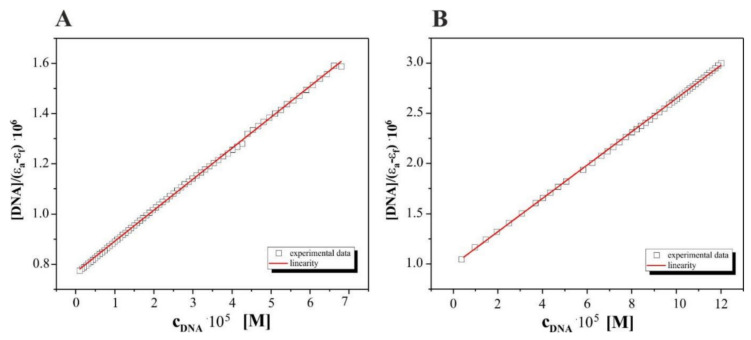
Figure 7.
Individual plots of [DNA]/(εa − εf) vs. [DNA] for the absorption titration of DNA (E.coli) with complexes: (A). [CoCl2(dap)2]Cl (1) and (B). [CoCl2(en)2]Cl (2) studied in Tris–HCl buffer; association constant Kb: 0.75·103 M−1 (R = 0.99950, n = 70 experimental points) for (1); .Kb: 8.0·105 M−1 (R = 0.99987, n = 46 experimental points) for (2).

