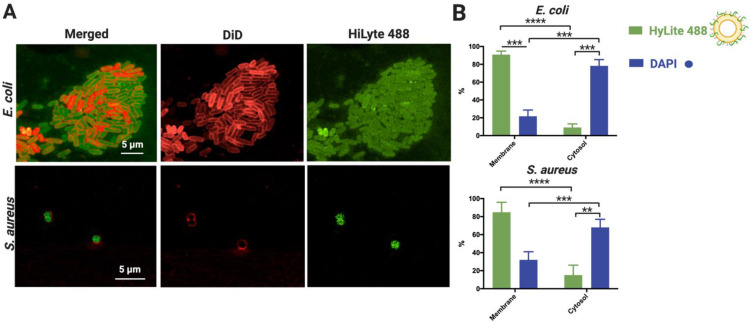
Figure 4.
Assessment of HiLyte 488 labeled NAM-ONs internalization by post-PEGylated lipoplexes in HEPES buffer, upon 1 h incubation. (A) Representative CLSM images of E. coli (top) and S. aureus (bottom) showing NAM-ONs (green fluorescence) internalized in the cytosol. Bacterial membranes were labeled with DiD dye (red fluorescence). Merged and separate channels are represented. Scale bar represents 5 μm. (B) Percentage (%) of NAM-ONs localized in the cytosol and in the membrane, calculated using Equation (4). A DAPI control of cytosol labeling was performed. Three independent experiments were done. Results are represented as mean values and respective standard deviations. Statistical differences are indicated when appropriate (p ≤ 0.0001, ****; p ≤ 0.001, ***; and p ≤ 0.01, **).

