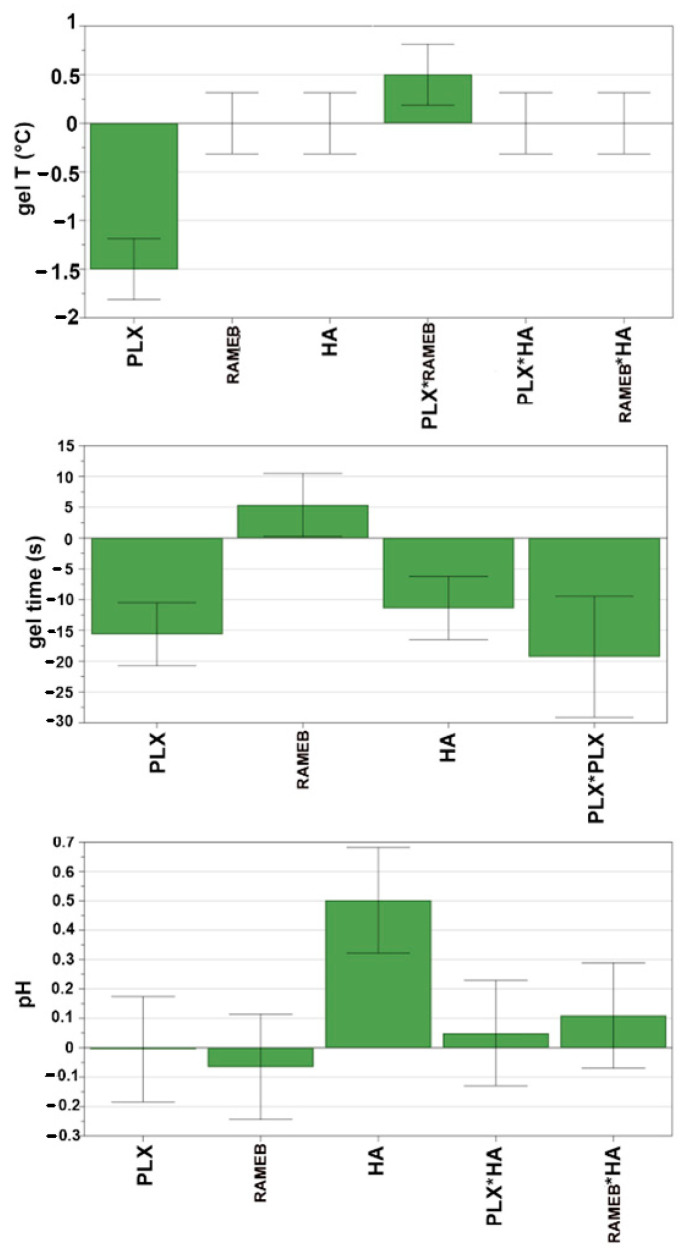
Figure 2.
Coefficients plots for gelation temperature, gelation time and pH. Positive and negative bars indicate, respectively, an increment or decrement of the response caused by the term. * is the interaction between the two terms. Non-significant terms have error bars that cross the horizontal axis.

