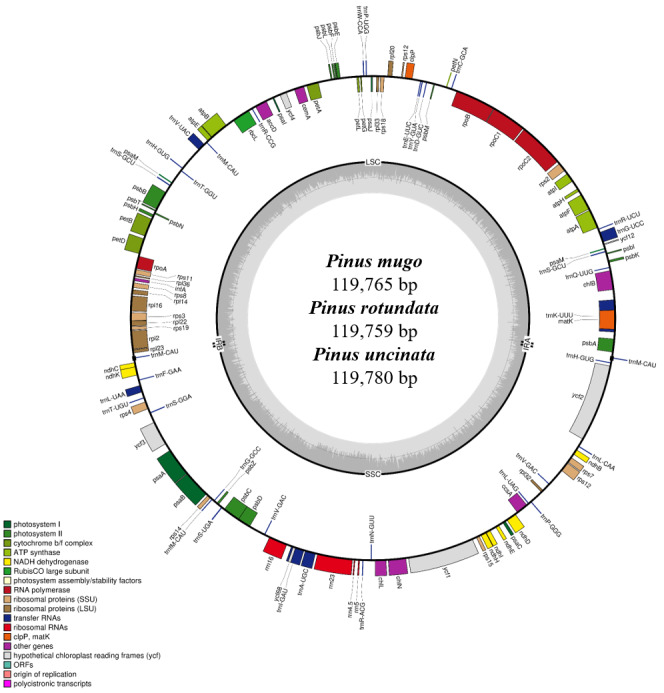
Figure 1.

Gene maps of the three Pinus chloroplast genomes. The genes inside the circle are transcribed clockwise, and those outside are transcribed counterclockwise. Genes of different functions are color coded. The darker gray in the inner circle shows the GC content, while the lighter gray shows the AT content. IRA, IRB, inverted repeats; LSC, large single copy region; SSC, small single copy region.
