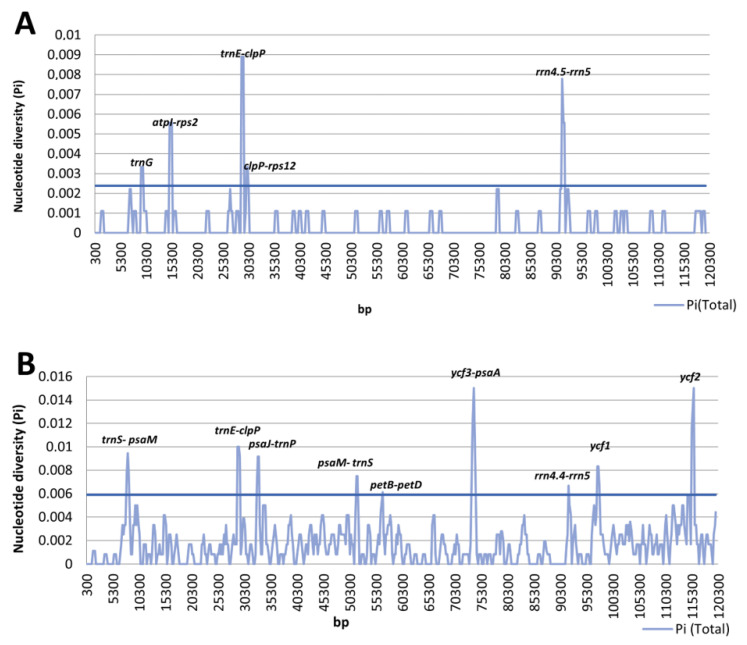
Figure 3.
Sliding window analysis of the whole chloroplast genomes. Window length: 600 bp; step size: 200 bp. X-axis: position of the midpoint of a window. Y-axis: nucleotide diversity of each window. (A) Pi between three the Pinus mugo complex representatives. (B) Pi among the Pinus mugo complex representatives and Pinus sylvestris. The horizontal line on the graph sets the threshold separately for the Pinus mugo complex representatives (0.00238) and separately for the Pinus mugo complex representatives and Pinus sylvestris (0.00589).

