Figure 1.
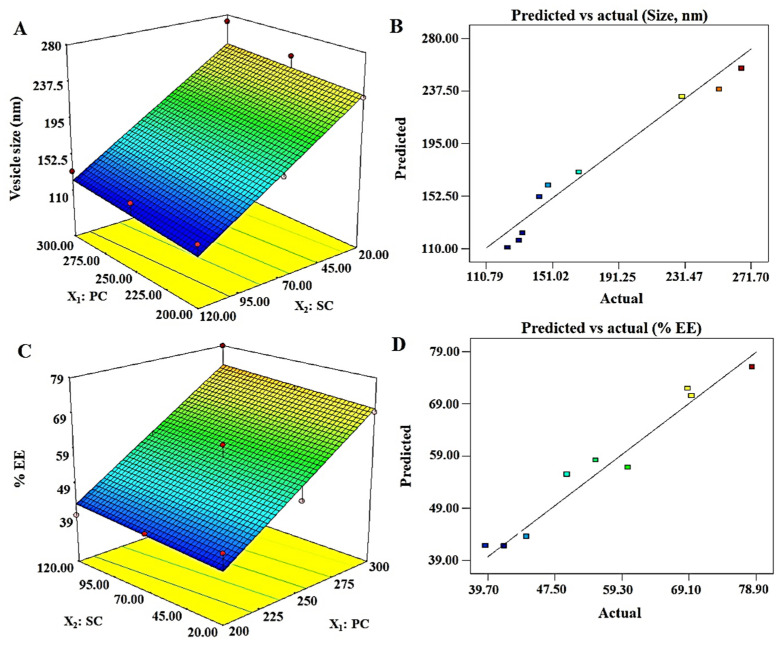
Software generated three-dimensional response surface plots and predicted vs. actual plots for the vesicle size (Y1) and % EE (Y2): (A) 3D response surface plot of Y1 illustrating an increment in size with increase in PC (phosphatidylcholine), whereas the size decrease with increase in SC (sodium cholate) content; (B) good correlation plot between predicted and actual values of vesicle size; (C) 3D response surface plot of Y2, which revealed a proportional relationship of both factors with the response; and (D) a good correlation of predicted versus actual values of % EE.

