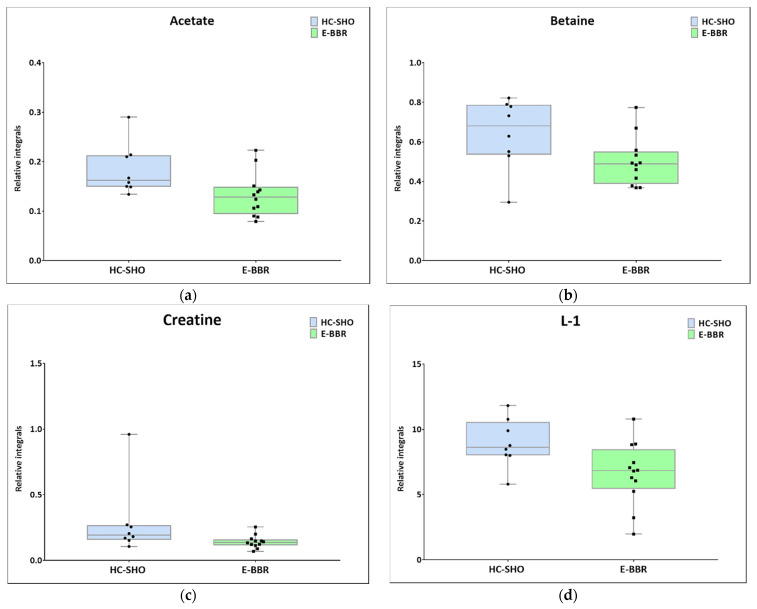
Figure 7.
Boxplots for metabolites with statistically significant (p < 0.05) showed the metabolites changes in comparisons between EC and HC-SHO groups. (a) Acetate. (b) Betaine. (c) Creatine. (d) L-1_VLDL (0.84 ppm). Blue bars–HC-SHO, green bars–for E-BBR, Whiskers–1.5 × interquartile range (IQR); bar–average; box–range between first quartile (Q1) and third quartile (Q3). Black circle–data point for HC-SHO, black square–data point for E-BBR.

