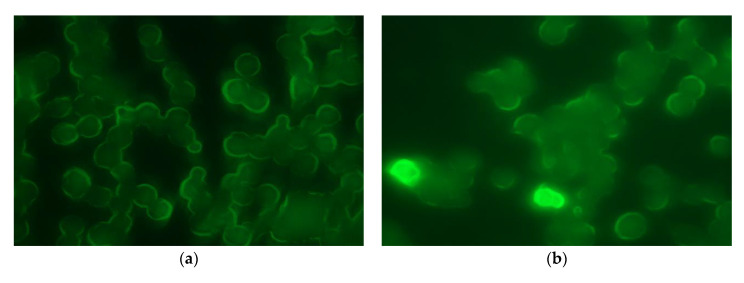
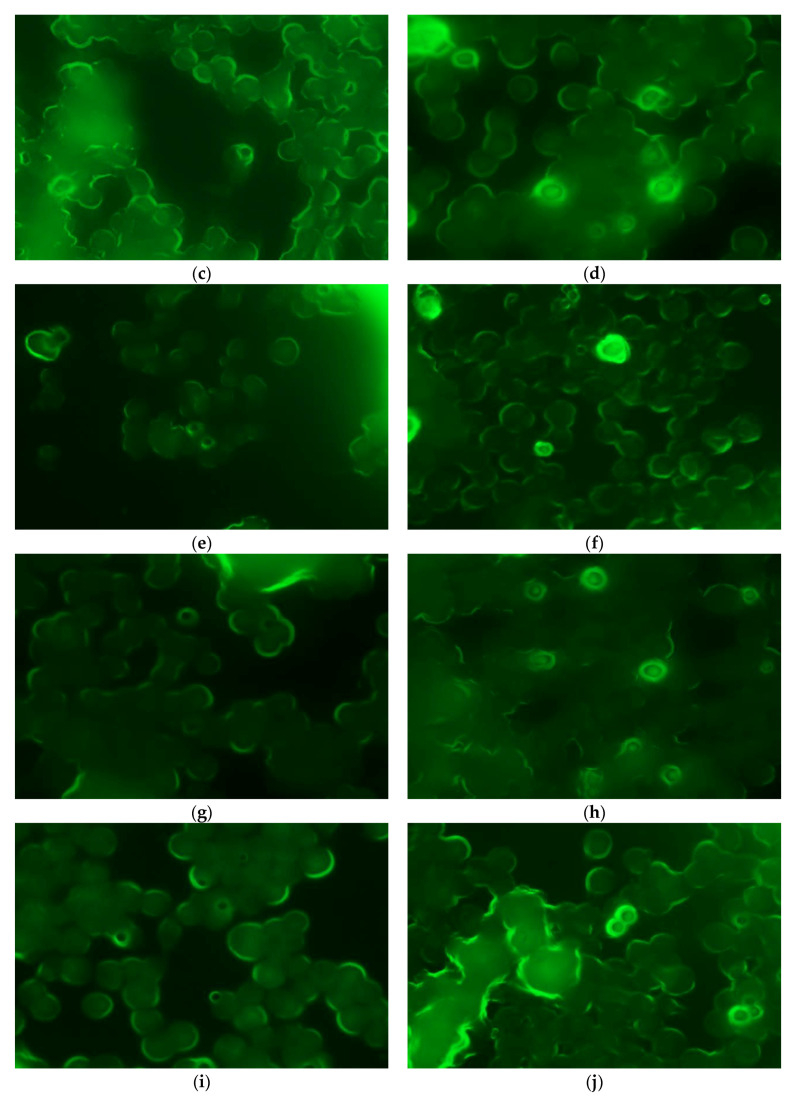
Figure 3.
Fluorescence microscopy images (×60) of macrophages obtained at different times after incubation with formulations: (a) F-AF at 0.5 h, (b) F-AFE at 0.5 h, (c) F-AF at 1 h, (d) F-AFE at 1 h, (e) F-AF at 2 h, (f) FAFE at 2 h (g) F-AF at 3 h, (h) F-AFE at 3 h, (i) F-AF at 5 h and (j) F-AFE at 5 h.


