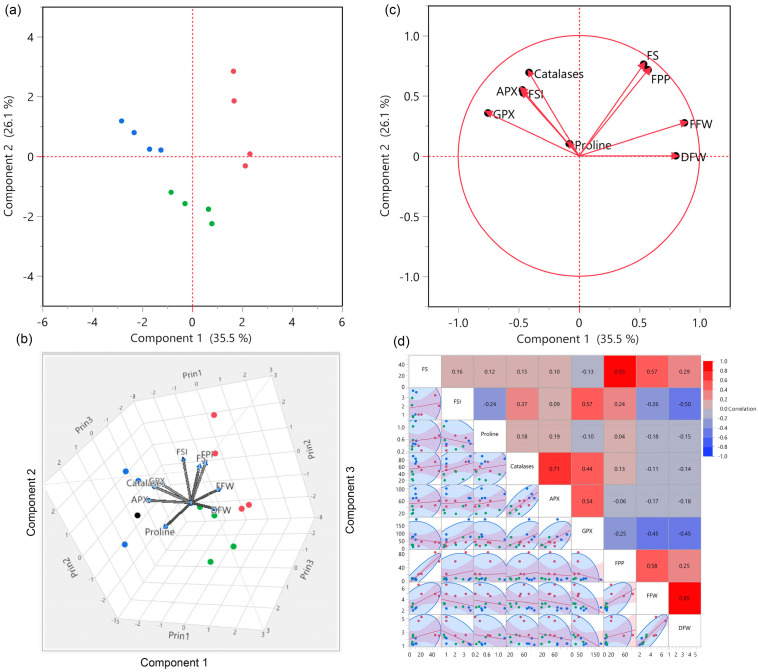
Figure 2.
PCA, biplot, and correlogram of antioxidants and production traits in four hot and bell pepper genotypes under three different environments. (a–c) biplot distribution of four pepper genotypes under three different conditions. (d) correlogram of antioxidants and production traits. According to the color scheme, red indicates the cluster of genotypes under control, green under D(F), and blue under D(P).

