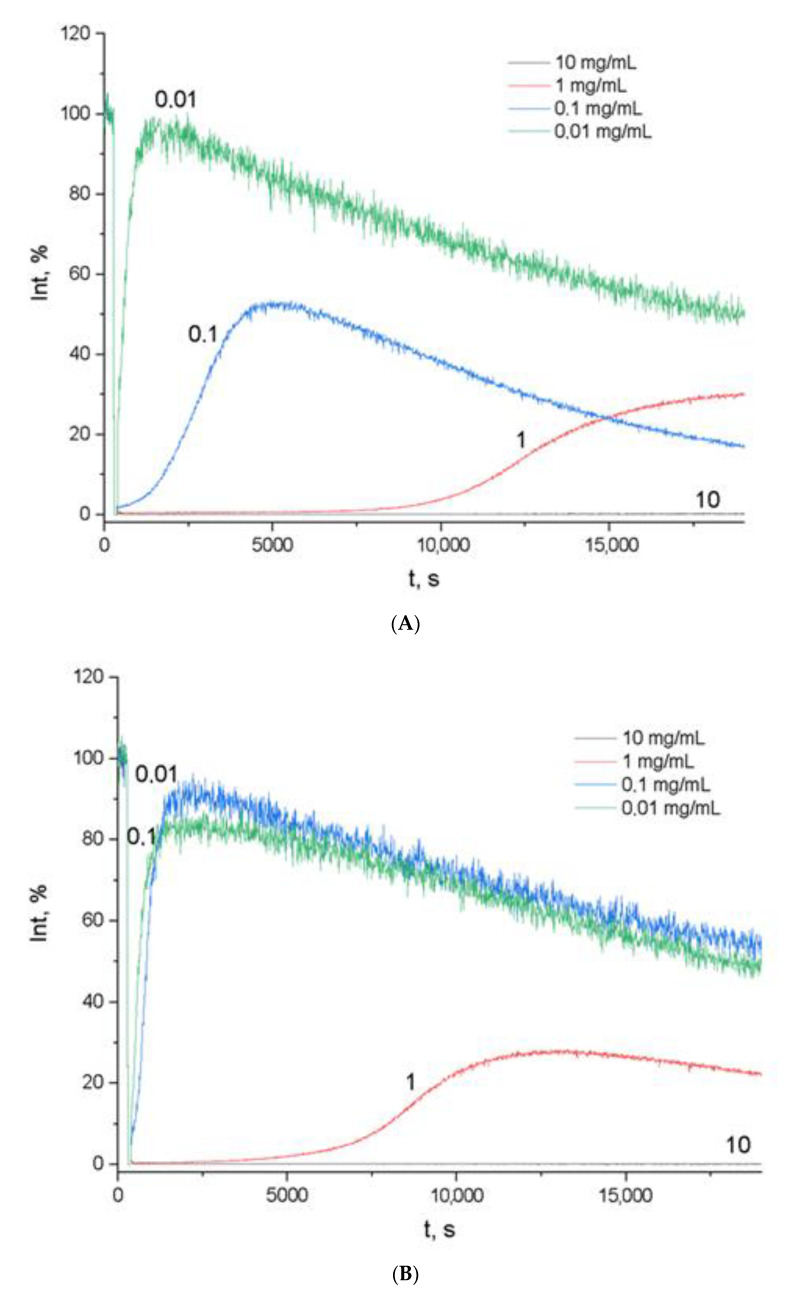
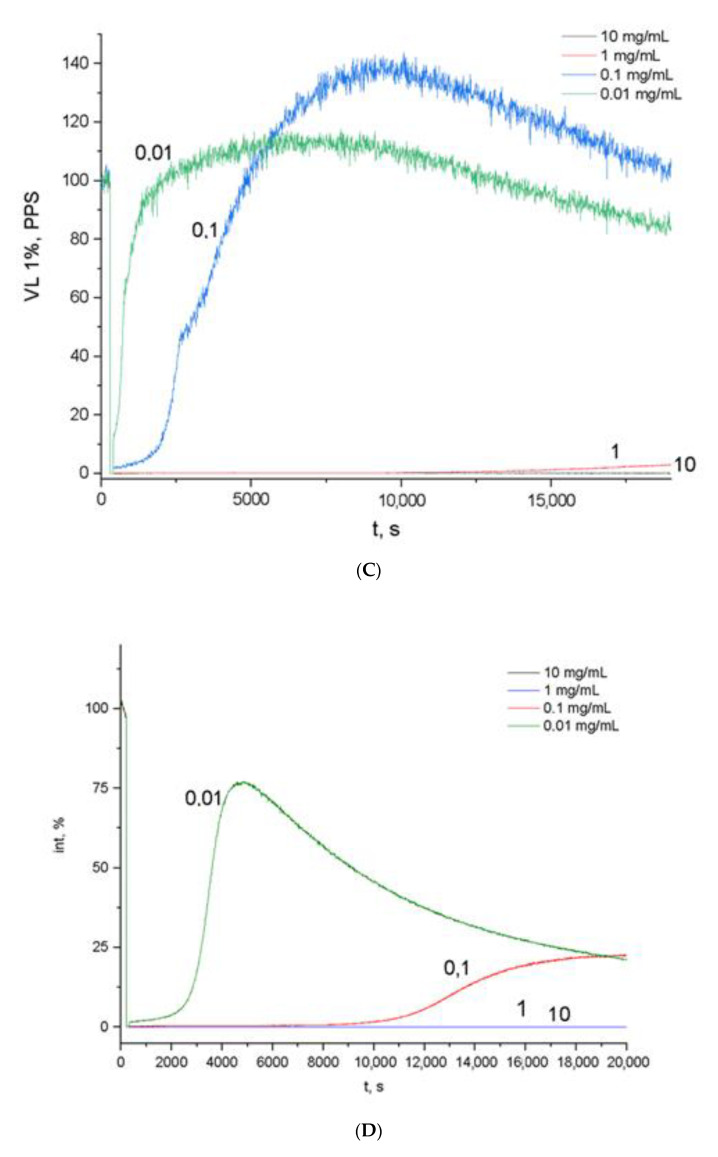
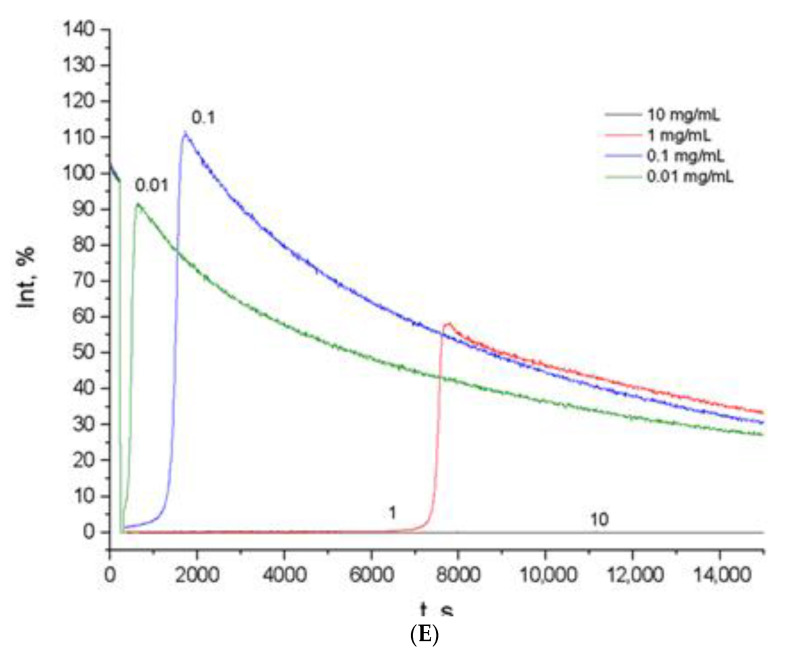
Figure 1.
Chemiluminescence intensity vs. time of ethanol extracts from flowers of Centaurea cyanus L. (A), Centaurea scabiosa L. (B), Centaurea jacea L. (C), quercetin (D), and Trolox (E). The numbers beside the curves are the concentrations of Centaurea L. ethanol extract, dihydroquercetin, and Trolox (mg/mL). Time (s) is plotted on the abscissa axis and chemiluminescence intensity (a.u.) is plotted on the ordinate axis.


