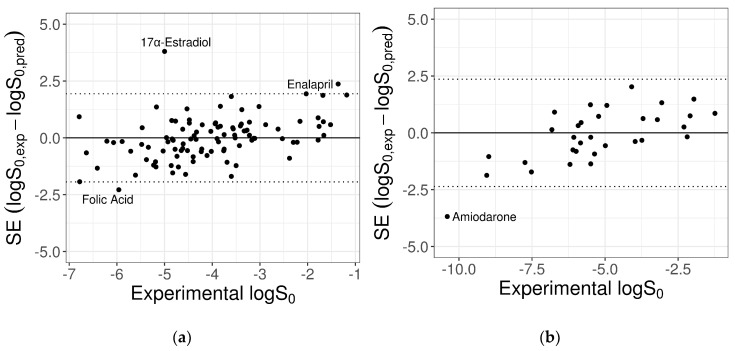
Figure 4.
Plots of the SE versus experimental logS0 for the 100-compound low-variance tight set (a) and the 32-compound high-variance loose set (b) provided by the SC-2. Dotted lines mark the cut-off threshold for outliers equal to 2×RMSE (test 1: 2.32 log unit; test 2: 2.48 log unit). Names of outlier compounds are displayed.

