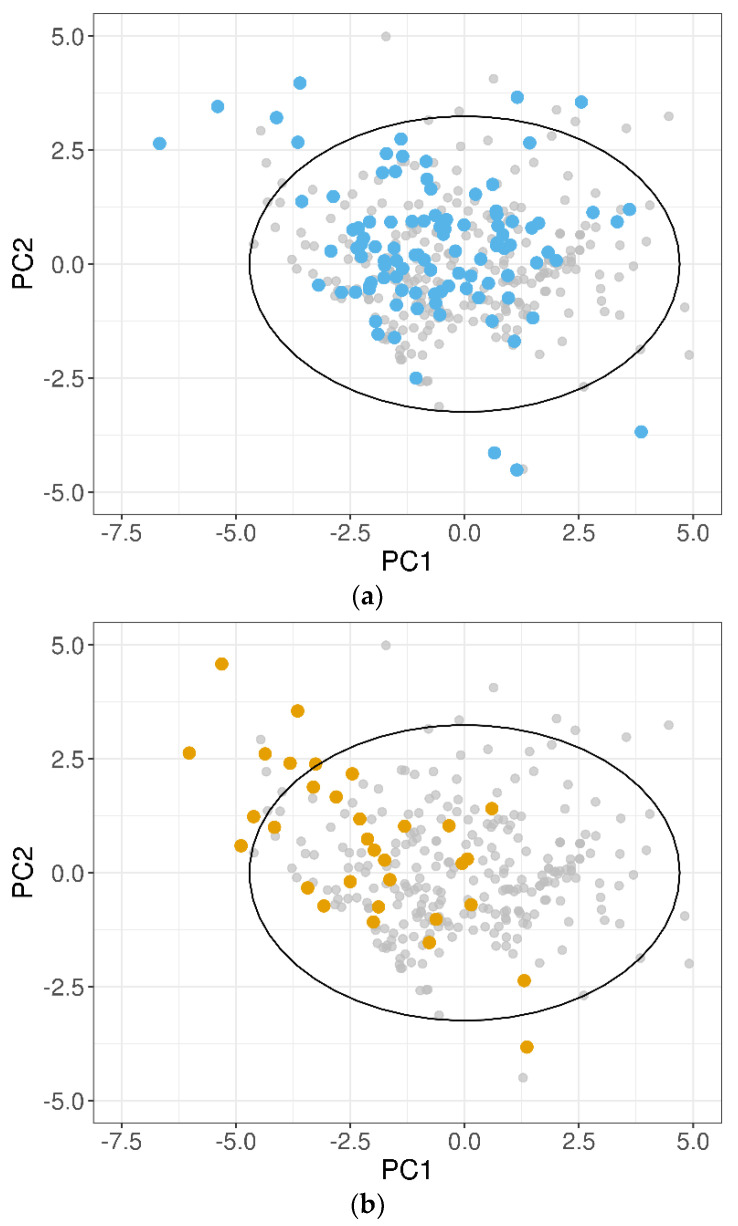
Figure 5.
Projections of the (a) 100-compound test set 1 (blue dots) and (b) 32-compound test set 2 (orange dots) on the two most important PCs of the training dataset. Grey dots show the position of the training compounds. The black solid ellipse marks the 95% confidence interval of the training domain.

