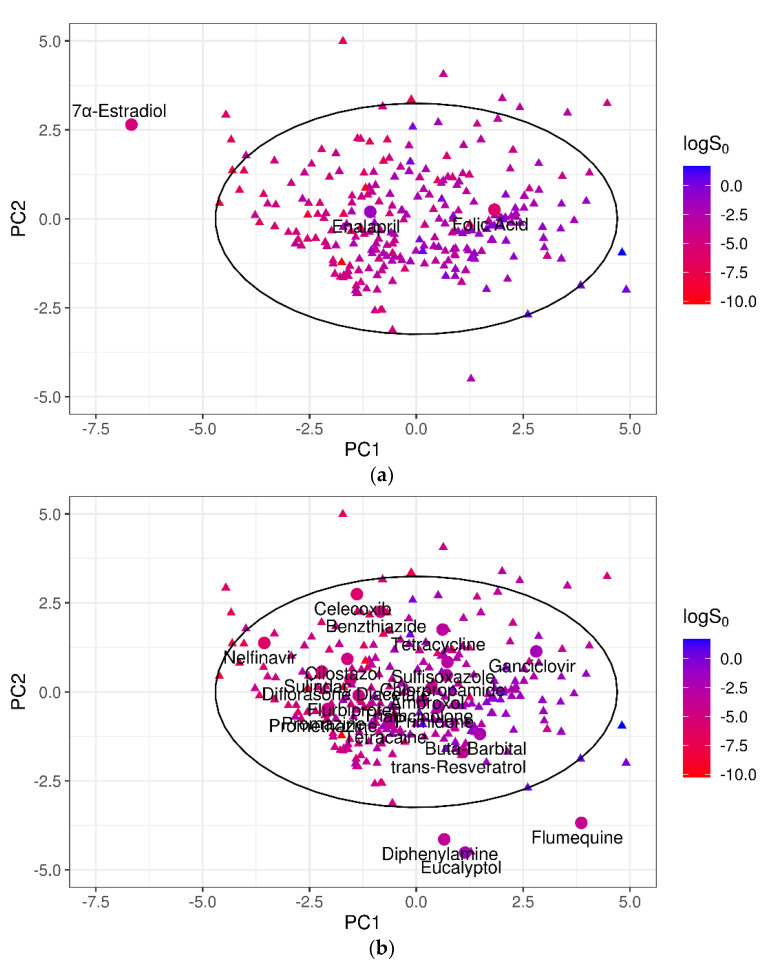
Figure 6.
(a) Projection of the three worst-predicted outliers of test set 1 in the PC1–PC2 dimensional space. (b) Projection of the 22 best-predicted compounds of test set 1 in the PC1–PC2 dimensional space. Circles mark the test compounds; triangles represent the 270 training molecules; and the black solid ellipse marks the 95% CI of the training domain. For both training and test compounds, solubility value is represented by color.

