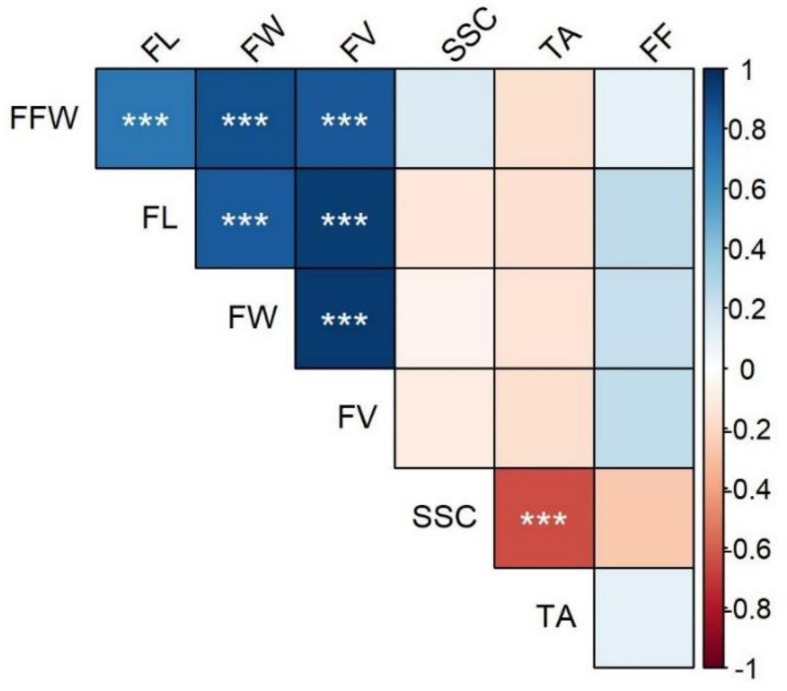
Figure 1.
Correlogram (Pearson) of the quantitative variables of the fruits. Pairwise correlations between variables (see Table 2. for the code) are colour-mapped according to the colour scale of the bar on the right-hand side. Asterisks indicate statistically significant correlations (***: p < 0.001).

