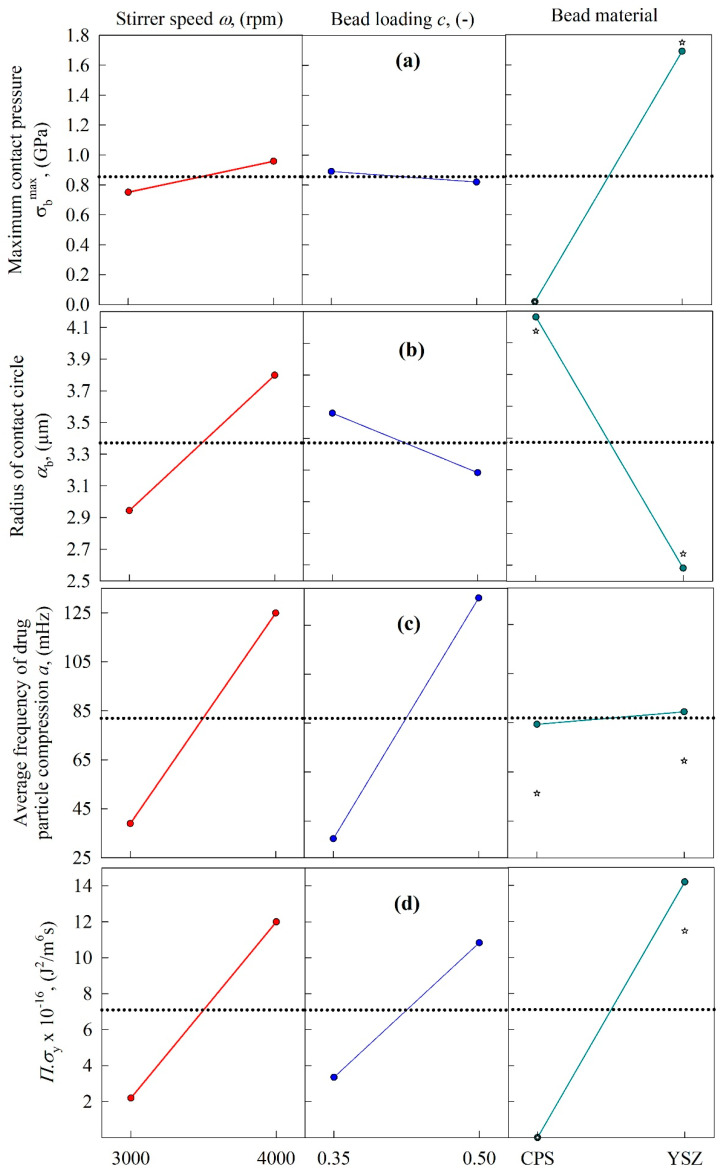
Figure 9.
Main effects plots for the microhydrodynamic parameters as a function of the following process variables: (a) maximum contact pressure σbmax, (b) radius of contact circle αb, (c) average frequency of drug particle compression a, and (d) the pseudo energy dissipation rate Πσy. The center point experimental data (Runs 9 and 10) were added to the rightmost panel.

