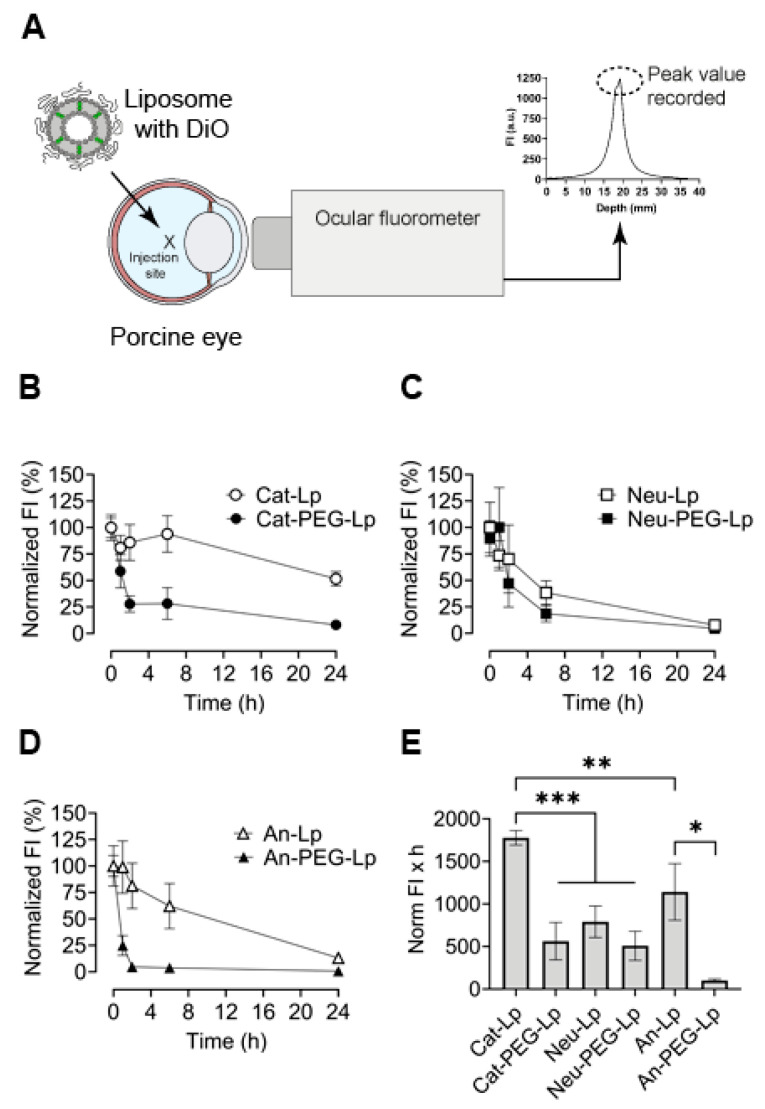
Figure 1.
Diffusion dynamics of liposomes (Lp) intravitreally administered to intact ex vivo porcine eyes. (A) Liposomes were loaded with a hydrophobic green fluorophore (DiO), injected into the center of eyes. DiO signal was recorded non-invasively after specific time-points on an ocular fluorophotometer. (B–D) Peak signal was used to plot the normalized fluorescent intensity (FI) over time for cationic (Cat), neutrally charged (Neu), and anionic (An) formulations with or without poly(ethylene glycol) (PEG) grafted on the liposome surface. (E) The area under the normalized FI-time curves (B–D) was determined for each formulation. Results represent mean ± SEM for n = 4–6. * = p < 0.05, ** = p < 0.01, *** = p < 0.001. Statistical analysis: One-way ANOVA with Tukey‘s post-hoc test.

