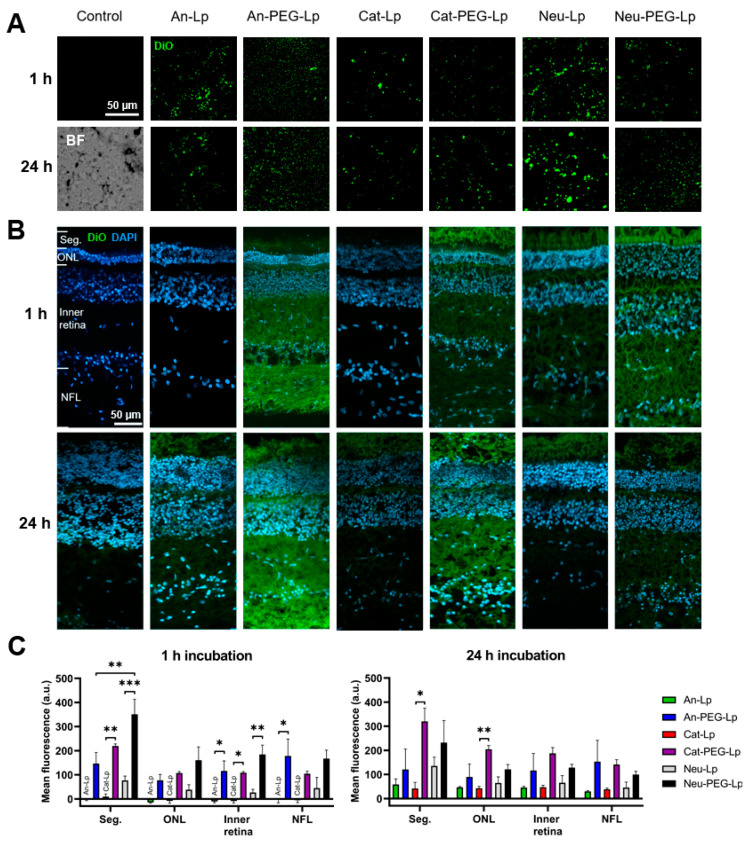
Figure 2.
Histological analysis of ex vivo porcine vitreous and retinas from eyes that were fixed either 1 or 24 h after injection with liposome formulations. A green hydrophobic dye (DiO) was encapsulated in the formulations. (A) Images from vitreous sections after injection. Control = no liposomes injected. BF = bright-field image showing the structure of the vitreous. (B) Retina sections after injection. To analyze the retinal distribution of the fluorescent dye, the fluorescent intensity of different layers in the retina was quantified on the microscope software. The layers are depicted in the first image in the top right and are: photoreceptor inner and outer segments (Seg.), outer nuclear layer (ONL), inner retina (from the ganglion cell layer to the outer plexiform layer), and the nerve fiber layer (NFL). (C) Quantification of average fluorescent signal from retinal layers after 1 or 24 h post-injection into ex vivo porcine eyes. Control sections were used to obtain the background signal, which was subtracted from the other conditions. Results represent mean ± SEM for n = 3. * = p < 0.05, ** = p < 0.01, *** p < 0.001. Statistical analysis: One-way AVONA with Tukey’s post-hoc test.

