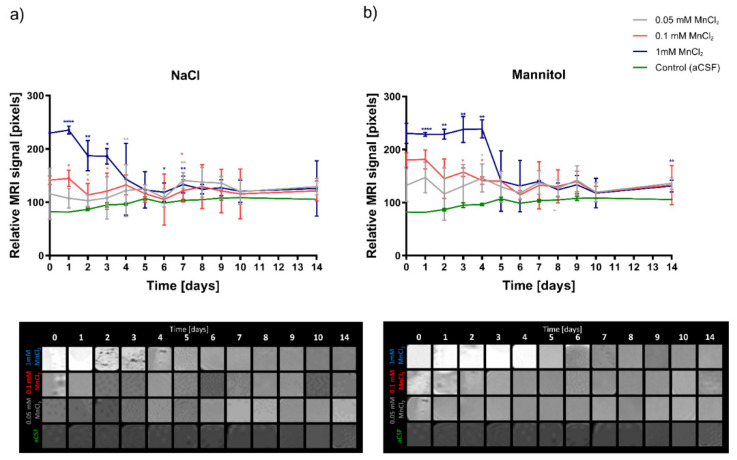
Figure 1.
Optimization of the MRI signal of hydrogels in different diluents. (a) LVM hydrogels dissolved in 0.9% NaCl, (b) LVM hydrogels dissolved in mannitol. Data are expressed as mean with standard deviation (SD) and differences were considered as statistically significant at the 95% confidence level (* p < 0.05, ** p < 0.01, **** p < 0.0001).

