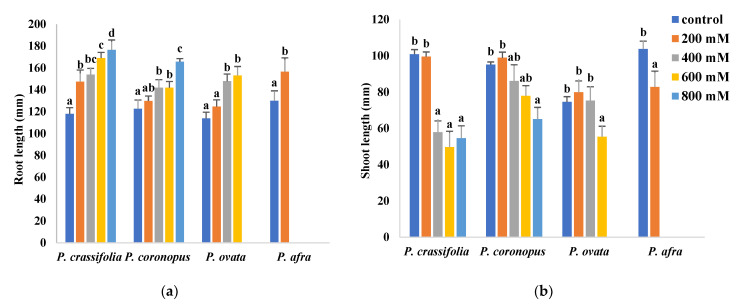
Figure 1.
Root length (a) and shoot length (b) of the four selected Plantago species after four weeks of treatment with the indicated NaCl concentrations. The values shown are means ± SE (n = 5). For each species, different letters over the bars indicate significant differences between treatments, according to the Tukey test (p < 0.5).

